Figures & data
Table 1. Descriptive statistics of student perceptions on all domains subject to improvement.
Table 2. Pearson correlation coefficients based on the total scores across domains.
Figure 1. Estimated conditional mean independent correlations.
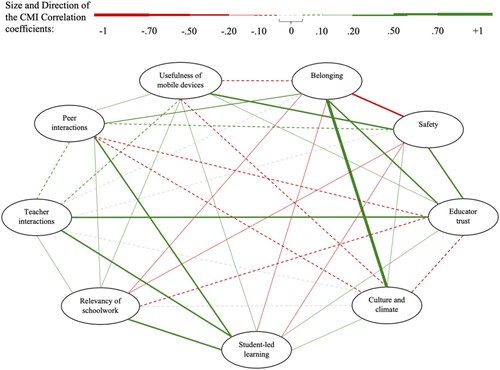
Table 3. Estimated Conditional Mean Independent Correlations (CMIC) between domains.
Figure 2. Estimates and confidence intervals of the unrestricted and restricted Conditional Mean Independent Correlations (CMIC). The x axis represents the direction and strength of the CMIC coefficient between the improvement domain that is written vertically and the domain that is written horizontally on the left side of the graph.
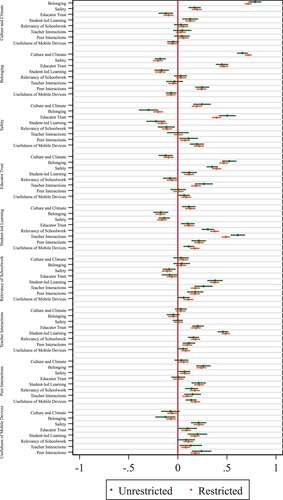
Figure 3. Estimates and confidence intervals of the Conditional Mean Independent Correlations (CMIC) with and without inclusion of observed background characteristics. The x axis represents the direction and strength of the CMIC coefficient between the improvement domain that is written vertically and the domain that is written horizontally on the left side of the graph.
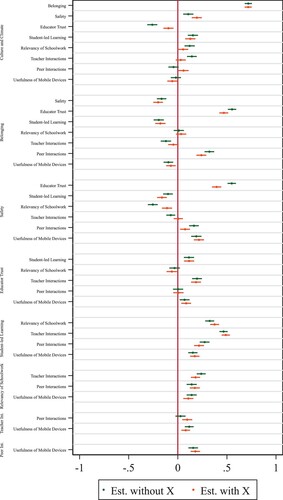
Table 4. Ranking highest impact improvement based on Maximize Growth (MG).
Table 5. Ranking highest impact improvement based on Maximize Growth with Preference Weights (MG-PW).
Table 6. Ranking highest impact improvement based on Maximize Growth with Inequality Penalty (MG-IP).
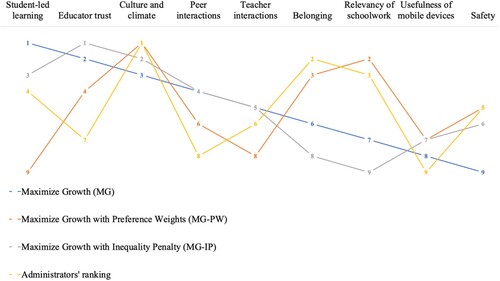
Figure 4. Rankings of highest impact improvement domains based on CMIC and growth functions and administrators’ reports. The rank-order values are based upon the numbers 1–9.