
Figures & data
Figure 1. Why target RNA with small molecules? (a) RNAs perform a myriad of functions, which are often mediated by structurally conserved motifs. The HIV-1 transactivation response (TAR), severe acute respiratory syndrome coronavirus 2 (SARS-CoV-2) stem loop 5 (SL5), and the flavin mononucleotide (FMN) riboswitch, whose secondary structures are shown, are a few examples of functional RNA motifs that are structurally conserved. (b) Many bioactive small molecules that act on RNA targets have now been identified. The equilibrium dissociation constant (Kd), 1.5 maximal effective concentration (EC1.5) or median inhibitory concentration (IC50) are provided. (c) Like the proteome, the transcriptome is likely to contain many druggable sites [Citation2], as the ones depicted in red spheres. The druggable sites on the FMN riboswitch (PDB ID: 3 f4g) [Citation3], add adenine riboswitch (PDB ID: 5swe) [Citation4], simian retrovirus type-1 (SRV-1) pseudoknot (PDB ID: 1e95) [Citation5], enterovirus 71 internal ribosomal entry sites (IRES) (PDB ID: 6xb7) [Citation6], HIV-1 TAR (PDB ID: 1qd3) [Citation7], UGGAA/UGGAA pentad in spinocerebellar ataxia type 31 (SCA31) [Citation8] were calculated using Fpocket [Citation9].
![Figure 1. Why target RNA with small molecules? (a) RNAs perform a myriad of functions, which are often mediated by structurally conserved motifs. The HIV-1 transactivation response (TAR), severe acute respiratory syndrome coronavirus 2 (SARS-CoV-2) stem loop 5 (SL5), and the flavin mononucleotide (FMN) riboswitch, whose secondary structures are shown, are a few examples of functional RNA motifs that are structurally conserved. (b) Many bioactive small molecules that act on RNA targets have now been identified. The equilibrium dissociation constant (Kd), 1.5 maximal effective concentration (EC1.5) or median inhibitory concentration (IC50) are provided. (c) Like the proteome, the transcriptome is likely to contain many druggable sites [Citation2], as the ones depicted in red spheres. The druggable sites on the FMN riboswitch (PDB ID: 3 f4g) [Citation3], add adenine riboswitch (PDB ID: 5swe) [Citation4], simian retrovirus type-1 (SRV-1) pseudoknot (PDB ID: 1e95) [Citation5], enterovirus 71 internal ribosomal entry sites (IRES) (PDB ID: 6xb7) [Citation6], HIV-1 TAR (PDB ID: 1qd3) [Citation7], UGGAA/UGGAA pentad in spinocerebellar ataxia type 31 (SCA31) [Citation8] were calculated using Fpocket [Citation9].](/cms/asset/c7b3b3bf-2d2b-40cc-80b2-dddb4028fd36/iedc_a_2134852_f0001_oc.jpg)
Table 1. List of programs for RNA secondary structure prediction.
Figure 2. Methods for identification of RNA targets. (a) SHAPE-MaP can be used to probe RNA secondary structures on a massively parallel scale. (b) MobyDick enables the analysis of RNA secondary structure predictions. When the analysis is completed, the MobyDick interface displays the locations, secondary structure, global population (PGlobal), and stability (∆G) of the motifs.
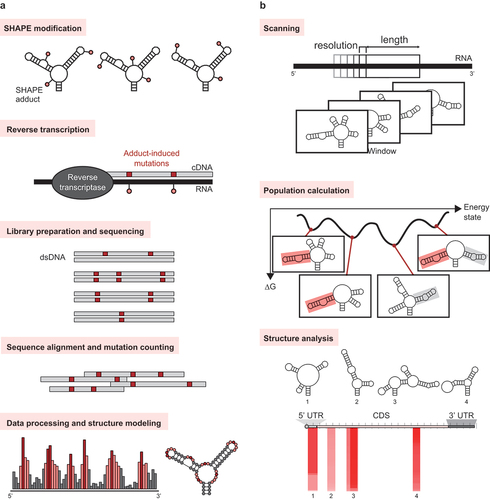
Figure 3. High-throughput screening approaches for identifying small molecule compounds that bind to RNA. (a) In fluorescence-based screening, a fluorescently labeled molecule – either the RNA target or an indicator – is used. Fluorescence resonance energy transfer (FRET) employs an RNA probe that is labeled with a fluorophore and a quencher. The FRET RNA probe is combined with the screening compounds and subjected to heating. The melting temperatures (Tm) of the RNA are measured using qPCR. Compounds that increase the Tm of the RNA bind to and stabilize the RNA. (b) Affinity-based screening methods do not require labeling of the RNA target. The automated ligand identification system (ALIS) is an indirect affinity-based screening method that involves the equilibration of the target RNA with a mixture of the screening compounds, size exclusion chromatography to purify the RNA–small molecule complexes, reverse-phase HPLC to dissociate the small molecules from the RNA, and mass spectrometry to identify the small molecule hits. (c) In small molecule microarray screening, the small molecules are immobilized onto microarray plates and used for screening against RNA targets. The hits are analyzed, e.g. by detecting increase in fluorescence if the RNA target is fluorescently labeled. (d) Fragment-based screening employs biophysical techniques, usually NMR, to identify low molecular weight compounds that bind to RNA targets. In 19F-NMR-based fragment screening, the 1D NMR spectra of mixtures of fluorinated compounds, before and after the addition of the RNA target, are taken. The hits are identified by looking for changes in the NMR signals of the fluorinated compounds; RNA-binding compounds exhibit more pronounced NMR signals after the addition of RNA. (e) In a typical DNA-encoded library (DEL) screening against RNA targets, the RNA is immobilized and incubated with small molecule compounds conjugated to a DNA barcode. The DEL members that bind to the RNA are eluted, and their identities are revealed after DNA amplification and sequencing. (f) Docking is the most widely used virtual screening approach. It requires that the three-dimensional structure of the RNA target be known so that the binding energies between the RNA and the screening compounds can be predicted in silico. (g) Most of the well-known RNA-targeted small molecules have been identified using phenotypic screening. In this method, the small molecules are evaluated for their ability to produce the desired phenotype within a cellular environment. The identity of RNA target is only revealed after molecular target identification and mechanistic studies.
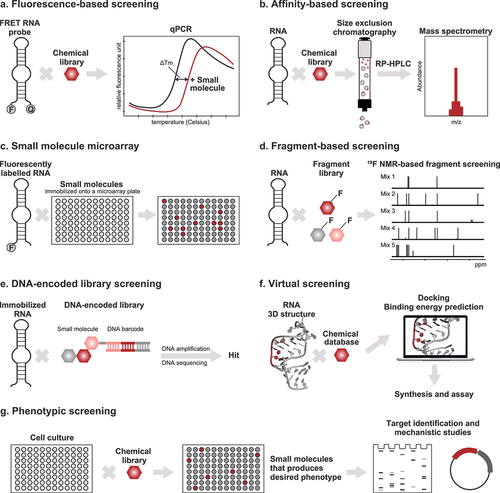
Table 2. Selected screens conducted against RNA targets*.
Figure 4. Biophysical techniques for confirming and validating hit compounds. (a) In an ITC experiment, the reference and sample cells should contain the same buffer because mismatched buffers lead to large background heats during the titration. Each peak in the raw data counts for one injection of the ligand solution, and the respective enthalpy is measured. The data is analyzed by fitting a sigmoidal curve to the released or absorbed enthalpy per mol plotted against the molar ratio. The binding affinity and stoichiometry can be determined from the fitted curve. (b) For SPR measurements, it is generally recommended to use low surface densities of the immobilized RNA and high ligand flow rate for accurate determination of kinetic constants. SPR causes a dip in the intensity of the reflected light at the sensor surface. A shift in the curve represents binding of the ligand to the RNA. An SPR sensogram can be divided into the association, steady state or equilibrium, and dissociation phases. (c) Since BLI experiments are conducted in uncovered plates and using small volumes, the entire experiment should be conducted swiftly (< 4 hours) to limit excessive evaporation, which can impact experimental results. In BLI, changes in the number of molecules bound to the biosensor tip shift the interference pattern that can be monitored in real-time. Association and dissociation are measured by dipping the sensor in solutions with or without the ligand, respectively. (d) Prior to MST assays, different assay conditions should be tested because the type of buffer, pH, and ionic strength can influence the thermophoretic movement of molecules and dramatically change the outcome. The RNA and ligand solutions are incubated and filled into a glass capillary. At a specific temperature, an infrared laser generates a temperature gradient, and RNA-small molecule complexes move slower in that gradient than unbound RNA. A binding curve can be generated from the difference between the fluorescence signals of the bound and unbound states, from which a binding constant can be derived. (e) The H1 and H3 protons of guanosines and uridines, respectively, as well as the H5–H6 crosspeaks of pyrimidines, can be perturbed after small molecule binding. By obtaining the 1H and 2D 1H −1H NMR spectra of the RNA target prior to and after the addition of small molecules, one can monitor these perturbations and determine if the small molecule binds to the RNA and which RNA residues bind the small molecule.
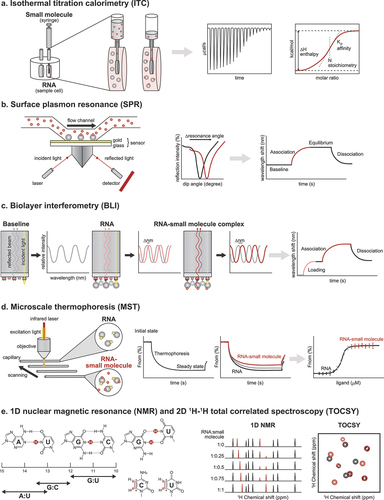
Table 3. Techniques to assess engagement of small molecules to RNA targets.
Figure 5. Comparison of the techniques for the determination of the 3D structures of RNA–small-molecule complexes. (a) X-ray crystallography can provide atomic resolution structures for RNAs of any size but requires a large amount of sample that must be crystallized. The crystal structure of the FMN riboswitch in complex with the compound, BRX1151 (red), is shown [Citation22]. (b) Unlike X-ray crystallography, solution-state NMR structures provide information about the dynamics of the RNA target, but it also requires large amounts of sample and is not suited for solving the 3D structures of large RNAs. The solution structure of the UGGAA-UGGAA RNA pentad in complex with the naphthyridine carbamate dimer (NCD, red) is shown [Citation8]. (c) In recent years, the resolutions of cryo-EM structures of RNAs are improving, but it is still only suitable for large RNAs or RNA–protein complexes. Cryo-EM requires only a small amount of sample, and the obtained structures are closer to the RNA’s native state than the X-ray structures. The cryo-EM structure of the SAM IV riboswitch–SAM (red) complex is shown [Citation161].
![Figure 5. Comparison of the techniques for the determination of the 3D structures of RNA–small-molecule complexes. (a) X-ray crystallography can provide atomic resolution structures for RNAs of any size but requires a large amount of sample that must be crystallized. The crystal structure of the FMN riboswitch in complex with the compound, BRX1151 (red), is shown [Citation22]. (b) Unlike X-ray crystallography, solution-state NMR structures provide information about the dynamics of the RNA target, but it also requires large amounts of sample and is not suited for solving the 3D structures of large RNAs. The solution structure of the UGGAA-UGGAA RNA pentad in complex with the naphthyridine carbamate dimer (NCD, red) is shown [Citation8]. (c) In recent years, the resolutions of cryo-EM structures of RNAs are improving, but it is still only suitable for large RNAs or RNA–protein complexes. Cryo-EM requires only a small amount of sample, and the obtained structures are closer to the RNA’s native state than the X-ray structures. The cryo-EM structure of the SAM IV riboswitch–SAM (red) complex is shown [Citation161].](/cms/asset/3ca361a9-1942-4ce0-aec6-672e471712e3/iedc_a_2134852_f0005_oc.jpg)