Figures & data
Table 1. Details of video clips used during the experiment
Table 2. Details of participants
Table 3. Intralingual accuracy rates of each group
Table 4. Average translation errors for all subgroups
Table 5. Average recognition errors for all subgroups
Table 6. Effective editions vs. content omissions by group
Table 7. Interlingual accuracy rates of each group
Figure 1. The NER model (Romero-Fresco and Martínez Citation2015, 32)
Figure 2. The NTR model (Romero-Fresco and Pöchhacker Citation2017)
Figure 3. Example of a content omission error
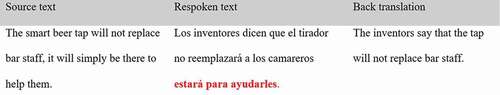
Figure 4. Example of a content substitution error
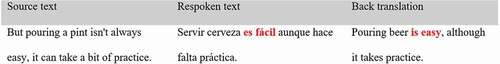
Figure 5. Example of a content addition error
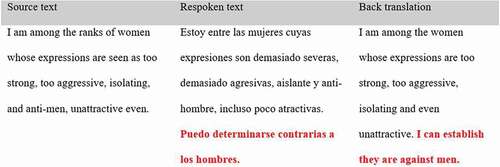
Figure 6. Example of a form correctness error
Figure 7. Example of a form style error
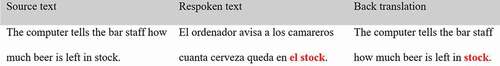
Figure 8. Example of effective editions
Figure 9. Task-specific skills required for interlingual respeaking