Figures & data
Figure 1. Expression, purification, and initial crystallization of rat TRPV6. (a) Map of the BacMam vector for rTRPV6 expression. The rTRPV6 construct has a C-terminal thrombin cleavage site followed by eGFP and a Strep affinity tag. The vector includes polyhedrin and CMV promoters, an ampicillin resistance selection marker, Tn7R transposition sites and an SV40 polyadenylation signal. (b) FSEC profiles for rTRPV6-C2 and rTRPV6-C2-L495Q constructs expressed in HEK 293 cells. (c–d) An image of an rTRPV6-C2-L495Q crystal in a hanging drop (c) and its diffraction pattern (d).
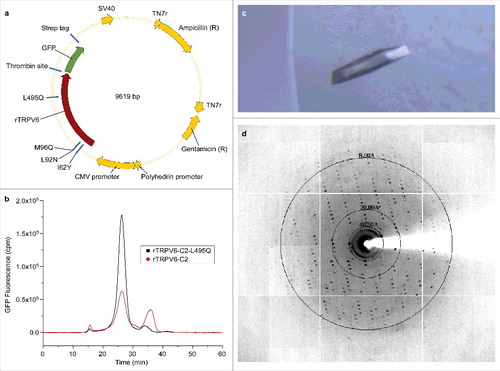
Figure 2. S1-S2 loop deletions. (a) Sequence alignment of the rTRPV6 constructs containing different size S1-S2 loop deletions. The glycosylation site is marked with the ¥ symbol. (b) FSEC profiles for the deletion constructs. (c) An example of an rTRPV6-C2-del4 crystal grown in a hanging-drop optimization tray.
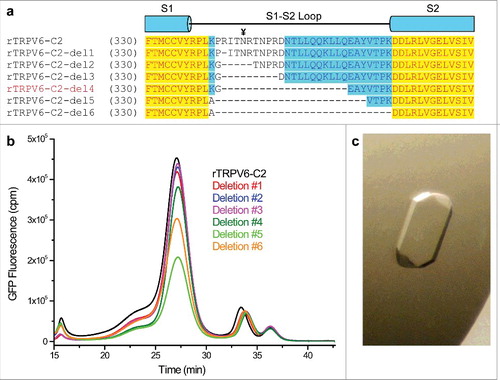
Figure 3. Low-resolution structure-driven engineering of crystal contacts. (a) Two protomers of rTRPV6-C2, representing the content of the asymmetric unit, viewed parallel to the membrane and colored purple and green. Blue mesh represents the electron density map at 1.0 σ. (b) Packing of rTRPV6-C2 into the C2221 space group crystal lattice. The protein content of the asymmetric unit is colored purple. The oval indicates the crystal contact formed between the ankyrin repeat domains. (c) Close-up view of the crystal contact with select residues shown in stick representation. (d) Table of mutations that were made to improve the crystal contacts.
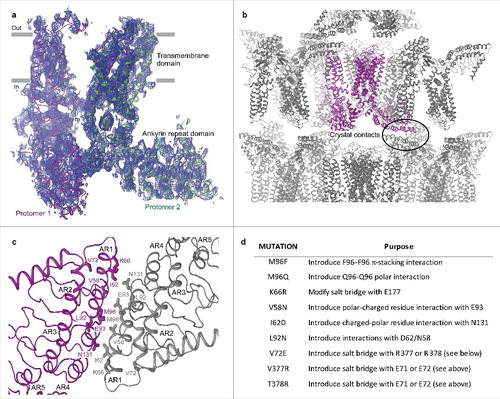
Figure 4. Crystallization of the RAD-NQ construct. (a) Example of an optimized RAD-NQ crystal flash frozen in a cryo-loop. The red box indicates boundaries of the X-ray beam. (b) 3.85 Å-resolution diffraction pattern for the RAD-NQ crystal. Inset is a magnified view of the diffraction pattern (red boxes). (c) Side view of the RAD-NQ tetramer that represents the content of the asymmetric unit. Each subunit is colored differently. Blue mesh represents the electron density map at 1.0 σ. (d–e) Close-up views of the electron density for the (d) ankyrin repeat and (e) transmembrane domains.
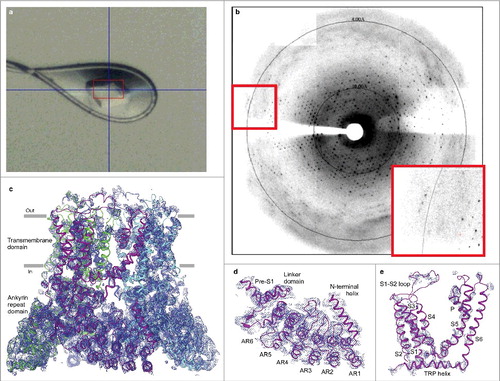
Figure 5. Pore loop transplantation from different ion channels. (a–d) Crystal contacts mediated by pore loops for (a) engineered voltage-gated calcium channel (PDB ID: 4MVM), (b) voltage gated sodium channel (PDB ID: 4F4L), (c) potassium channel KcsA (PDB ID: 1BL8) and (d) RAD-NQ. All structures were solved in the C2 space group. (e) Replaced sequences of the RAD-NQ pore loops aligned with the corresponding regions of the aforementioned channels. (f) FSEC profiles for different RAD-NQ pore loop chimera constructs. (g) Side view of the RAD-NQ-4MVM pore loop chimera tetramer that represents the content of the asymmetric unit. Each subunit is colored differently. Blue mesh represents the electron density map at 1.0 σ.
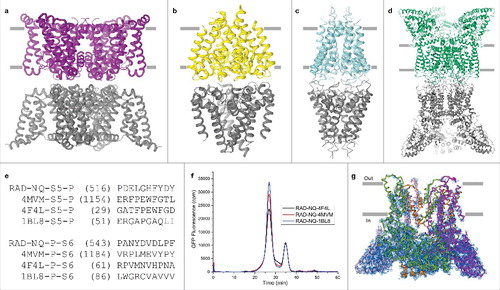
Figure 6. Ankyrin repeat fusion constructs. (a) Bottom view of the RAD-NQ tetramer with the ankyrin repeat 5 loop boxed and each monomer shown in a different color. (b) Magnified view of the ankyrin repeat 5 loop. The amino acid sequence (yellow) was replaced in each of the fusion constructs with a fusion partner. (c–g) Fusion partners inserted in the ankyrin repeat 5 loop: (c) BRIL (PDB ID: 1MHT), (d) FLAV (PDB ID: 1I1O), (e) PGS (PDB ID: 2BFW), (f) RUB (PDB ID: 1FHM) and (g) T4L (PDB ID: 170L). The double-headed arrows represent the N- to C- termini distances.
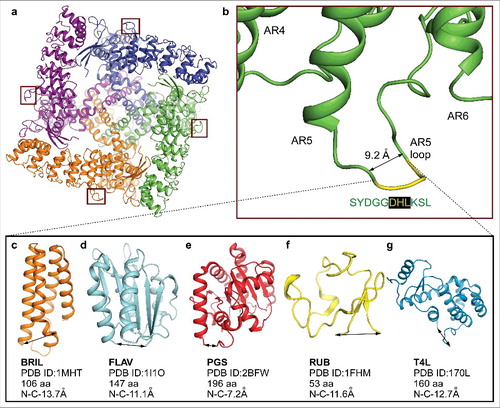
Figure 7. Purification and crystallization of the ankyrin repeat fusion constructs. (a) FSEC profiles for the purified ankyrin repeat fusion constructs. (b–d) Optimized crystals of the (b) T4L, (c) BRIL and (d) FLAV fusion constructs.
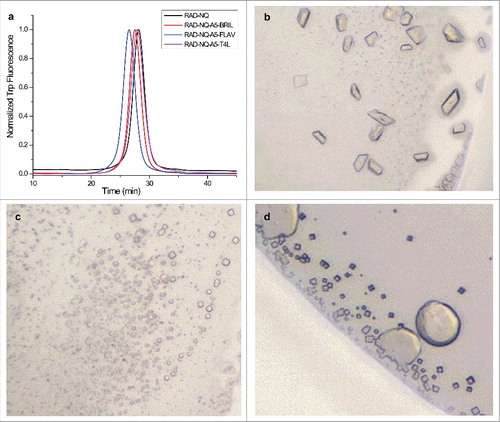
Figure 8. Crystallization of the rTRPV6-C2-NQ construct. (a) ∼4 Å-resolution diffraction pattern for the rTRPV6-C2-NQ crystal shown in the lower right corner inset. (b) Two protomers of rTRPV6-C2-NQ representing the content of the asymmetric unit, viewed parallel to the membrane and colored green and purple. Blue mesh represents the electron density map at 1.0 σ. (c-d) Close-up views of the electron density for the (c) transmembrane and (d) ankyrin repeat domains.
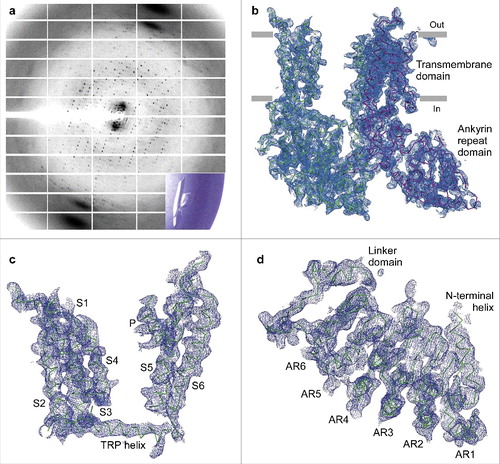
Figure 9. Crystallographic analysis of TRPV6cryst. (a) ∼3.25 Å-resolution diffraction pattern for the TRPV6cryst crystal shown in the lower right corner inset. (b) TRPV6cryst monomer representing the content of the asymmetric unit, viewed parallel to the membrane. Blue mesh represents the electron density map at 1.0 σ. (c) Close up view of the TRPV6cryst crystal contact with the side chains of I62Y and M96Q shown in stick representation. (d) Orthogonal view of the TRPV6cryst P4212 space group crystal lattice. The protein content of the asymmetric unit is colored purple. (e-f) Ribbon models of the TRPV6cryst pore with bound Ca2+ (e, green spheres) or Gd3+ (f, blue spheres). Only two of four subunits are shown with the front and back subunits omitted for clarity. Residues important for cation binding are shown as sticks. Blue mesh represents the anomalous difference Fourier maps generated from diffraction data collected at 1.75 Å wavelength for Ca2+ (e, 2.3 σ) and 1.56 Å wavelength for Gd3+ (f, 8.0 σ).
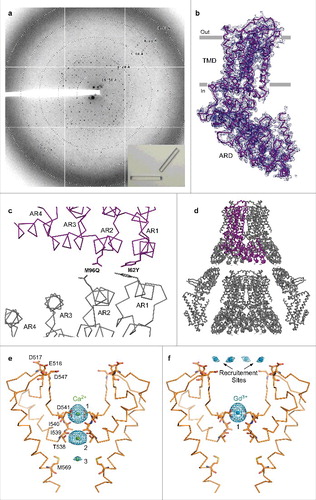
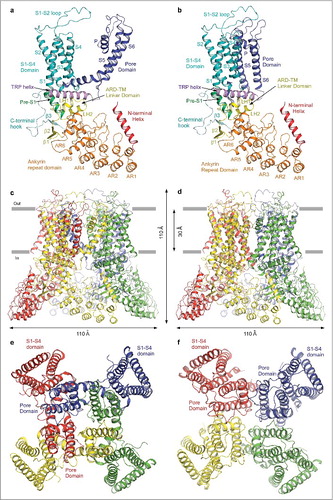
Figure 10. Swapped and non-swapped transmembrane domain arrangements in TRPV6. (a–b) Swapped TRPV6* (a) and non-swapped TRPV6cryst (b) monomers are colored according to their domains. (c–f) Swapped TRPV6* (c,e) and non-swapped TRPV6cryst (d,f) tetramers viewed parallel to the membrane (c–d) or extracellularly (e–f), with subunits shown in different colors. The S1-S4 domains are adjacent to the pore domains from the same subunits in TRPV6cryst, but are adjacent to the pore domains from neighboring subunits in TRPV6*.