Figures & data
Figure 1. Norwegian sports system
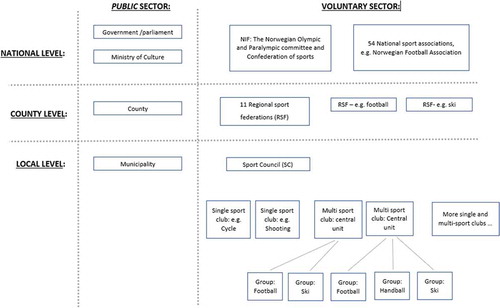
Figure 2. Sports club network. Size of nodes reflects number of members; colour of nodes represents sports
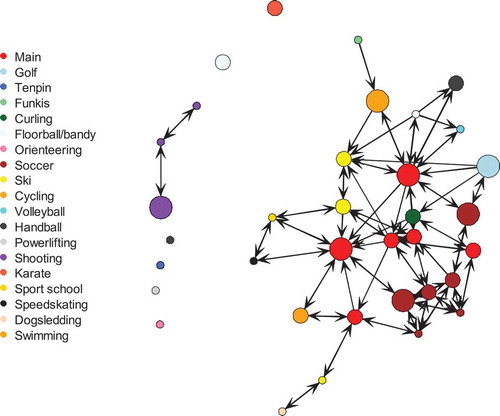
Figure 3. Sports policy networks, coloured by sector
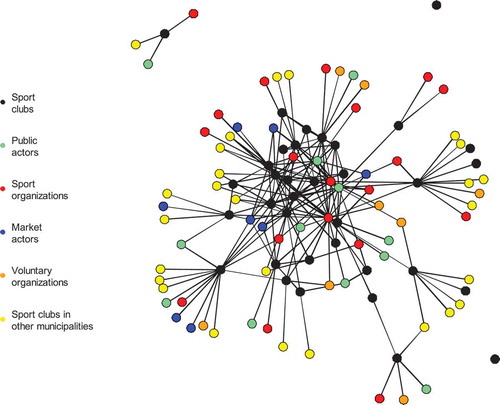
Figure 4. Distribution of degrees (a) sports clubs, (b) actors in policy network
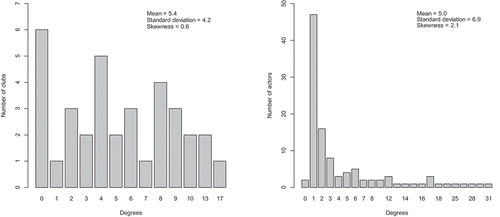
Table 1. Descriptive network measures of sport club network and sport policy network.
Table 2. Sport club network. ERGM estimates, standard errors, z-values and statistical significance
Table 3. Sport policy network. ERGM estimates, standard errors, z-values and statistical significance
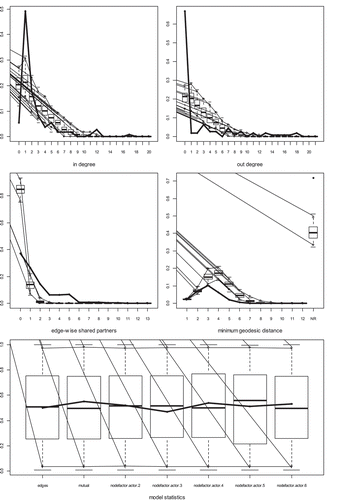
Figure A1 (appendix). Goodness of fit for Sport Club Network. A sample of graphs is randomly drawn from the specified model and the figures show the statistics of the quantiles for a selection of measures for the simulated sample. In a good fit, the observed statistics should be near the sample median (0.5)
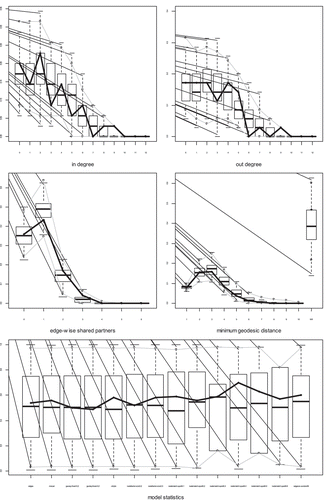
Figure A2 (appendix). Goodness of fit for Sport Policy Network. See for more info