3,042
Views
27
CrossRef citations to date
0
Altmetric
Reports

Analytical ultracentrifugation with fluorescence detection system reveals differences in complex formation between recombinant human TNF and different biological TNF antagonists in various environments

, , , , , , , , & show all
Pages 664-679 | Received 21 Nov 2016, Accepted 17 Feb 2017, Published online: 07 Apr 2017

Figures & data

Figure 1. UV-SV with 2 μM adalimumab (a), infliximab (b), and etanercept (c). The c(s) distributions in the absence of TNF (black) and of the 1:1 molar mixtures of the respective antagonist:TNF incubated at 20°C for 2 hours (blue) or at 37°C overnight (red) are shown.
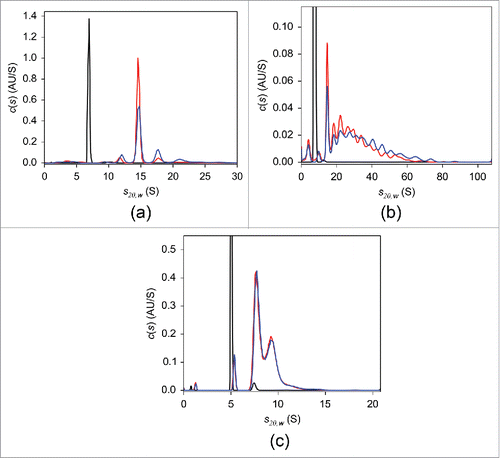
Figure 1. UV-SV with 2 μM adalimumab (a), infliximab (b), and etanercept (c). The c(s) distributions in the absence of TNF (black) and of the 1:1 molar mixtures of the respective antagonist:TNF incubated at 20°C for 2 hours (blue) or at 37°C overnight (red) are shown.

Figure 2. FDS-SV with 25 nM adalimumab (a), infliximab (b), and etanercept (c) in the presence of varying concentrations of TNF in PBS. The c(s) distributions in the absence of TNF (black) and of the 10:1 (blue), 2:1 (green), and 1:1 (red) molar mixtures of the respective antagonist:TNF are shown.
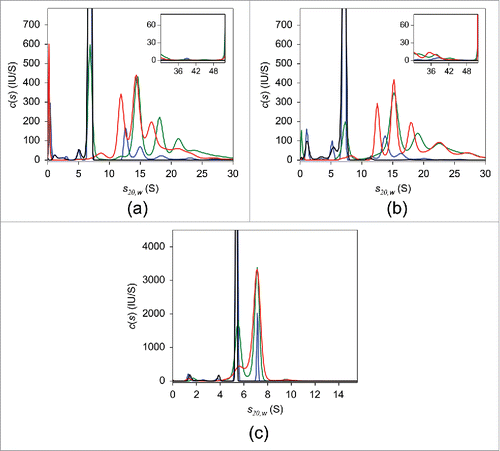
Figure 2. FDS-SV with 25 nM adalimumab (a), infliximab (b), and etanercept (c) in the presence of varying concentrations of TNF in PBS. The c(s) distributions in the absence of TNF (black) and of the 10:1 (blue), 2:1 (green), and 1:1 (red) molar mixtures of the respective antagonist:TNF are shown.

Table 1. TNF-antagonist complexes detected using native MS and AUC FDS-SV.

Table 2. The weight-average sedimentation coefficients calculated for each experimental condition.

Figure 3. Mass spectra of the TNF-adalimumab complexes. Mass spectra of the mixtures containing trimeric TNF:adalimumab at molar ratios of 1:0 (black), 1:1 (orange), 1:1.25 (green), 1:1.5 (red), 1:2 (cyan), and 0:1.5 (purple) are shown.
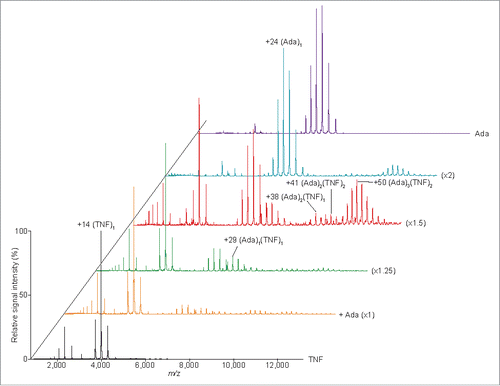
Figure 3. Mass spectra of the TNF-adalimumab complexes. Mass spectra of the mixtures containing trimeric TNF:adalimumab at molar ratios of 1:0 (black), 1:1 (orange), 1:1.25 (green), 1:1.5 (red), 1:2 (cyan), and 0:1.5 (purple) are shown.

Figure 4. ITC analysis of direct titration of 39.8 μM trimeric TNF into 9.8 μM adalimumab-Fab. Raw heat changes (top panel), normalized heat changes with best-fit values (solid line) (middle panel), and residuals of the fit (bottom panel) are shown. Non-linear regression analysis of the curves using A + B + B + B <-> AB + B + B <-> ABB + B <-> ABBB binding model yielded the Kd of 11.6 ± 1.7 nM and ΔH values of 11.6 ± 1.7 nM and -6.4 ± 0.1 kcal/mol, respectively, as determined from triplicate measurements. Representative profile from triplicate measurements is shown.
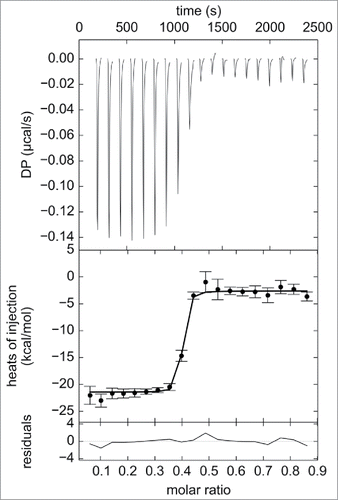
Figure 4. ITC analysis of direct titration of 39.8 μM trimeric TNF into 9.8 μM adalimumab-Fab. Raw heat changes (top panel), normalized heat changes with best-fit values (solid line) (middle panel), and residuals of the fit (bottom panel) are shown. Non-linear regression analysis of the curves using A + B + B + B <-> AB + B + B <-> ABB + B <-> ABBB binding model yielded the Kd of 11.6 ± 1.7 nM and ΔH values of 11.6 ± 1.7 nM and -6.4 ± 0.1 kcal/mol, respectively, as determined from triplicate measurements. Representative profile from triplicate measurements is shown.

Figure 5. Simulation analysis of the populations of each AbAg complex in an Ab-Ag mixture. Simulations were performed for the mixtures containing 25 nM Ab and 2.5–100 nM Ag using Kd of 11.6 ± 1.7 nM derived from the ITC analysis of direct titration of TNF into an adalimumab-Fab solution.
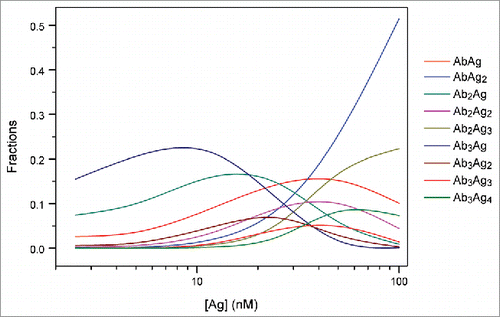
Figure 5. Simulation analysis of the populations of each AbAg complex in an Ab-Ag mixture. Simulations were performed for the mixtures containing 25 nM Ab and 2.5–100 nM Ag using Kd of 11.6 ± 1.7 nM derived from the ITC analysis of direct titration of TNF into an adalimumab-Fab solution.

Figure 6. FDS-SV with 25 nM adalimumab (a), infliximab (b), and etanercept (c) in the presence of varying concentrations of TNF in human serum. The c(s) distributions in the absence of TNF (black) and of the 10:1 (blue), 2:1 (green), and 1:1 (red) molar mixtures of the respective antagonist:TNF are shown.
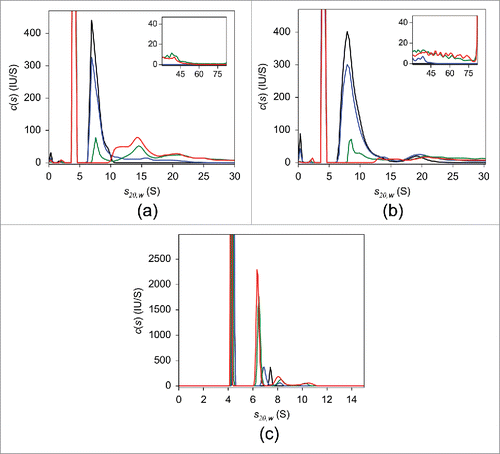
Figure 6. FDS-SV with 25 nM adalimumab (a), infliximab (b), and etanercept (c) in the presence of varying concentrations of TNF in human serum. The c(s) distributions in the absence of TNF (black) and of the 10:1 (blue), 2:1 (green), and 1:1 (red) molar mixtures of the respective antagonist:TNF are shown.

Figure 7. FDS-SV analysis in serial dilutions of HSA in PBS in the absence (a) or presence of 5 mg/mL human immunoglobulin (b). The c(s) distributions of 25 nM adalimumab in 0 (black), 1 (purple), 2.5 (blue), 5 (magenta), 10 (green), and 18 mg/mL (red) HSA are shown. For the clarity of presentation, the derived c(s) distributions were normalized against the height of the main peak.
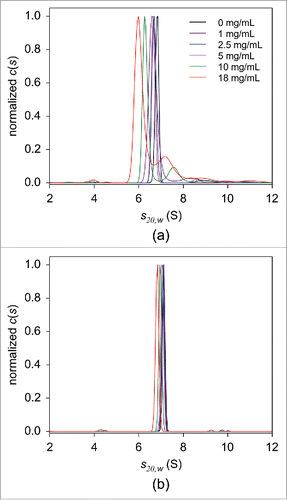
Figure 7. FDS-SV analysis in serial dilutions of HSA in PBS in the absence (a) or presence of 5 mg/mL human immunoglobulin (b). The c(s) distributions of 25 nM adalimumab in 0 (black), 1 (purple), 2.5 (blue), 5 (magenta), 10 (green), and 18 mg/mL (red) HSA are shown. For the clarity of presentation, the derived c(s) distributions were normalized against the height of the main peak.
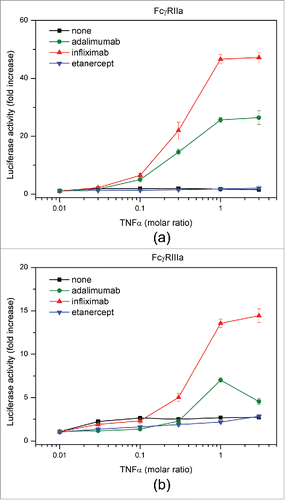
Figure 8. FcγR reporter cell assay. Activation of FcγRIIa (a) and FcγRIIIa (b) by adalimumab (green), infliximab (red), and etanercept (blue) in the presence of TNF was measured.

Figure 8. FcγR reporter cell assay. Activation of FcγRIIa (a) and FcγRIIIa (b) by adalimumab (green), infliximab (red), and etanercept (blue) in the presence of TNF was measured.
Supplemental material

Supplemental_Material.docx

Download MS Word (10.2 MB)