3,426
Views
20
CrossRef citations to date
0
Altmetric
Report

Toward in vitro-to-in vivo translation of monoclonal antibody pharmacokinetics: Application of a neonatal Fc receptor-mediated transcytosis assay to understand the interplaying clearance mechanisms

, , , ORCID Icon, , , ORCID Icon, , , , & show all
Pages 781-791 | Received 27 Jan 2017, Accepted 11 Apr 2017, Published online: 25 May 2017

Figures & data

Figure 1. Basolateral to apical flux (Papp) of a 3H-IgG and FITC-dextran across rat and human FcRn over-expressing MDCK cells and EV cells. The highest Papp was observed in the cell line over-expressing FcRn and under pH 6.0/8.0, indicating a specific FcRn-mediated antibody transport. Data is shown as mean ± SD; n = 3 (separate wells).
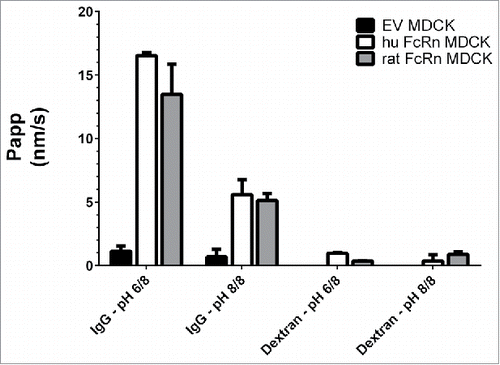
Figure 1. Basolateral to apical flux (Papp) of a 3H-IgG and FITC-dextran across rat and human FcRn over-expressing MDCK cells and EV cells. The highest Papp was observed in the cell line over-expressing FcRn and under pH 6.0/8.0, indicating a specific FcRn-mediated antibody transport. Data is shown as mean ± SD; n = 3 (separate wells).

Figure 2. Basolateral to apical flux (Papp) of FITC-labeled rat, mouse, human IgGs and chicken IgY across human FcRn and rat FcRn MDCK cells with a pH gradient (6.0/8.0). The inability of rodent IgG to bind to human FcRn was confirmed. Data is shown as mean ± SD; n = 3 (separate wells).
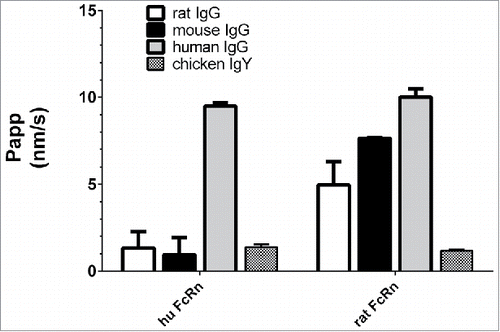
Figure 2. Basolateral to apical flux (Papp) of FITC-labeled rat, mouse, human IgGs and chicken IgY across human FcRn and rat FcRn MDCK cells with a pH gradient (6.0/8.0). The inability of rodent IgG to bind to human FcRn was confirmed. Data is shown as mean ± SD; n = 3 (separate wells).

Figure 3. Transcytosis of different 3H-labeled IgG Fc mutants and non-binding control (chicken IgY) at pH 6.0/8.0 in human FcRn MDCK cells and EV MDCK cells as negative control. AAA, Wt, and YTE IgG clearly differed by their flux (Papp). Paired t-test P value (AAA vs. Wt IgG) = 0.024; P value (YTE vs. Wt IgG) = 0.041; P value (AAA vs. YTE IgG) = 0.002; Data is shown as mean ± SD; n = 3 (separate wells).
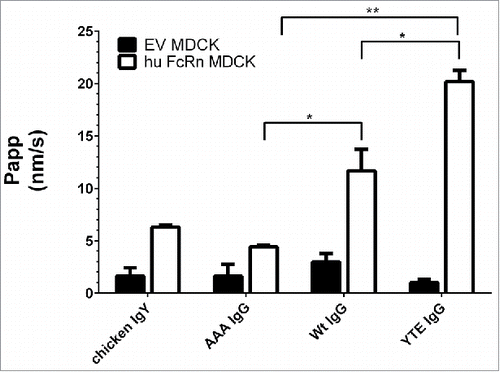
Figure 3. Transcytosis of different 3H-labeled IgG Fc mutants and non-binding control (chicken IgY) at pH 6.0/8.0 in human FcRn MDCK cells and EV MDCK cells as negative control. AAA, Wt, and YTE IgG clearly differed by their flux (Papp). Paired t-test P value (AAA vs. Wt IgG) = 0.024; P value (YTE vs. Wt IgG) = 0.041; P value (AAA vs. YTE IgG) = 0.002; Data is shown as mean ± SD; n = 3 (separate wells).

Figure 4. Effect of incubation time and donor/acceptor chamber pH on transcytosis of IgG mutants by human FcRn-over-expressing cells. The application of 5 h incubation time and a pH gradient of 6.0/7.4 differentiated the various molecules best. The fluxes were normalized to the flux of chicken IgY. Data is shown as mean ± SD; n  =  3 (separate wells).
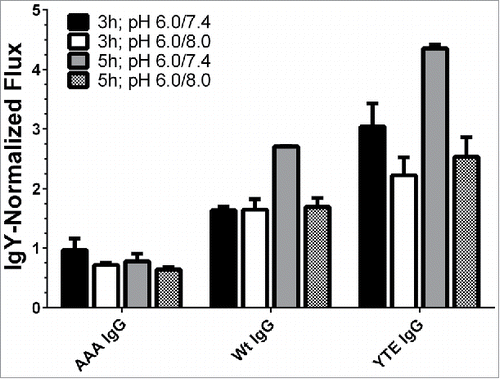
Figure 4. Effect of incubation time and donor/acceptor chamber pH on transcytosis of IgG mutants by human FcRn-over-expressing cells. The application of 5 h incubation time and a pH gradient of 6.0/7.4 differentiated the various molecules best. The fluxes were normalized to the flux of chicken IgY. Data is shown as mean ± SD; n  =  3 (separate wells).

Table 1. In vitro flux of IgG mutants across human and rat FcRn MDCK cells at pH 6.0/7.4.

Figure 5. Mean systemic clearance observed in rat after single mAb intravenous administration plotted against the reciprocal normalized flux obtained from the rat FcRn cellular transcytosis assay. IgY-normalized in vitro flux of 5 mAbs were inversely proportional with the corresponding in vivo CL values in rat. Data is shown as mean ± SD.
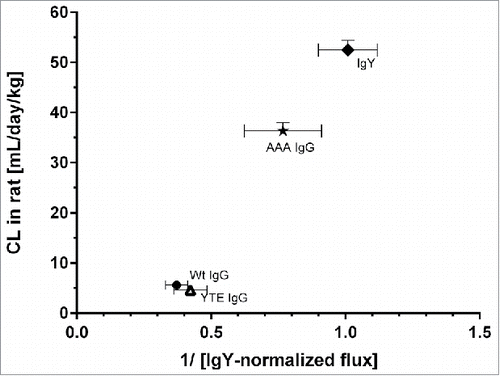
Figure 5. Mean systemic clearance observed in rat after single mAb intravenous administration plotted against the reciprocal normalized flux obtained from the rat FcRn cellular transcytosis assay. IgY-normalized in vitro flux of 5 mAbs were inversely proportional with the corresponding in vivo CL values in rat. Data is shown as mean ± SD.

Table 2. Human in vitro and cynomolgus monkey in vivo data used for the in vitro-in vivo correlation

Figure 6. (A) Correlation of reciprocal Wt IgG-normalized in vitro flux (pH gradient 6.0/7.4) of 7 mAbs across human FcRn MDCK cells with in vivo clearance in cynomolgus monkey. Data is plotted as mean values  ±  SD. Corresponding pairs of Fc mutant and Wt IgG are labeled with the same symbol (closed triangle, star, cross). The greyish area roughly indicates mAbs for which in vivo CL is hypothesized to be affected by “decelerating” processes, for mAbs in the white area “CL-accelerating” processes are thought to be involved. (B) Correlation of reciprocal Wt IgG-normalized in vitro flux (pH gradient 6.0/7.4) of 20 mAbs with wildtype FcRn binding ability across human FcRn MDCK cells with in vivo clearance in cynomolgus monkey. Data is plotted as mean values  ±  SD for CL and as reciprocal mean values of the Wt IgG-NF. The greyish area roughly indicates mAbs for which in vivo CL is hypothesized to be affected by “decelerating” processes, for mAbs in the white area “CL-accelerating” processes are thought to be involved.
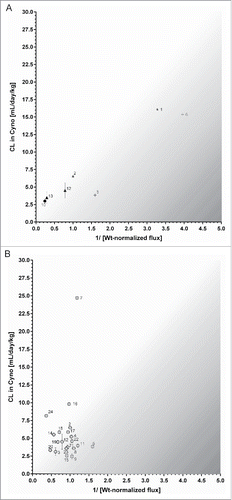
Figure 6. (A) Correlation of reciprocal Wt IgG-normalized in vitro flux (pH gradient 6.0/7.4) of 7 mAbs across human FcRn MDCK cells with in vivo clearance in cynomolgus monkey. Data is plotted as mean values  ±  SD. Corresponding pairs of Fc mutant and Wt IgG are labeled with the same symbol (closed triangle, star, cross). The greyish area roughly indicates mAbs for which in vivo CL is hypothesized to be affected by “decelerating” processes, for mAbs in the white area “CL-accelerating” processes are thought to be involved. (B) Correlation of reciprocal Wt IgG-normalized in vitro flux (pH gradient 6.0/7.4) of 20 mAbs with wildtype FcRn binding ability across human FcRn MDCK cells with in vivo clearance in cynomolgus monkey. Data is plotted as mean values  ±  SD for CL and as reciprocal mean values of the Wt IgG-NF. The greyish area roughly indicates mAbs for which in vivo CL is hypothesized to be affected by “decelerating” processes, for mAbs in the white area “CL-accelerating” processes are thought to be involved.
Supplemental material

Supplemental_Material.docx

Download MS Word (259.6 KB)

Reprints and Corporate Permissions

Please note: Selecting permissions does not provide access to the full text of the article, please see our help page How do I view content?

To request a reprint or corporate permissions for this article, please click on the relevant link below:

Academic Permissions

Please note: Selecting permissions does not provide access to the full text of the article, please see our help page How do I view content?

Obtain permissions instantly via Rightslink by clicking on the button below:

If you are unable to obtain permissions via Rightslink, please complete and submit this Permissions form. For more information, please visit our Permissions help page.