Figures & data
Figure 1. SE-HPLC analysis for mAb-PFM purification from the expression medium. (A) mAb-PFM eluted from a protein A column. (B) mAb-PFM monomer eluted from the subsequent cHA column (top panel), and the mixture of mAb-PFM monomer and HMW species stripped from the cHA column with high salt solution (bottom panel). The mobile phase was PBS. The peak identifications are as indicated in the figures.
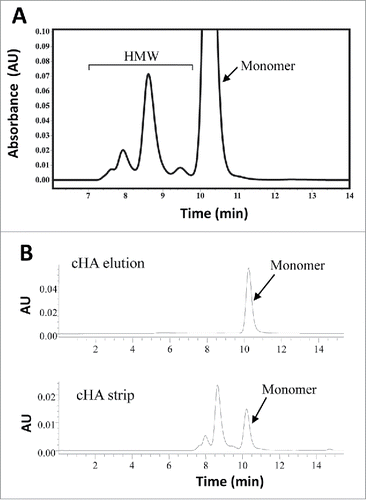
Figure 2. Biophysical characterizations for the cHA column purified monomer and cHA column enriched HMW fraction. (A) Overlay of analytical ultracentrifugation sedimentation velocity (AUC-SV) profiles for the purified monomer (red) and the enriched HMW species (blue). The total protein concentrations were 0.4–0.5 mg/mL. (B) Overlay of AUC-SV profiles for the enriched HMW species in PBS (black), 600 mM NaCl (red), and in the presence of 20% ethanol (blue). The samples were obtained by ∼5-fold dilution of the HMW sample in (A) with appropriate reagents. The profiles are not normalized with respect to sample concentrations. The sedimentation coefficients in (A) and (B) were corrected for the standard state of water at 20°C. The instrumentation and experimental procedures for AUC-SV were as described previously.Citation9 (C) Overlay of far-UV CD spectra for the monomer (red) and enriched HMW species (blue) in formulation buffer (dots) and with 6 M GdmCl (dashed lines). The instrumentation and experimental procedures for far-UV CD were as described previously.Citation9 (D) Overlay of intrinsic fluorescence emission spectra of the monomer (red) and enriched HMW species (blue) in formulation buffer (solid lines) and with 6 M GdmCl (dashed lines). Each curve in (C) and (D) represents triplicate measurements averaged at each data point.
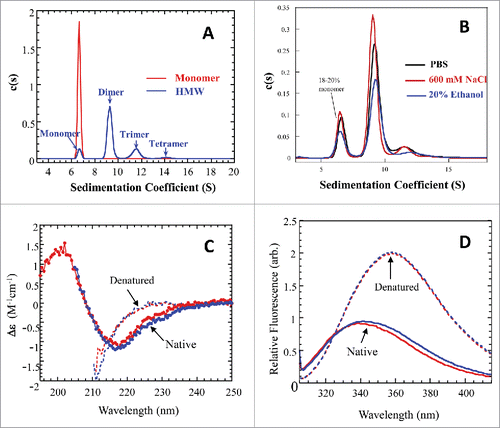
Figure 3. Biophysical characterizations for the denatured and refolded mAb-PFM monomer and HMW species. (A) Overlay of AUC-SV profiles for the denatured monomer (red) and HMW species (blue). The total protein concentrations were 0.4–0.5 mg/mL. (B) AUC-SV profiles for the refolded samples of the denatured monomer and HMW species, obtained by ∼10-fold dilution with PBS, followed by overnight incubation at 20°C. The sedimentation coefficients in (A) and (B) were corrected for the standard state of water at 20°C. The instrumentation and experimental procedures for AUC-SV were as described previously.Citation9 (C) Overlay of far-UV CD spectra for the monomers isolated by SEC from the refolded samples of the denatured monomer (red) and of the denatured HMW species (blue). The instrumentation and experimental procedures for far-UV CD were as described previously.Citation9 (D) Overlay of intrinsic fluorescence emission spectra for the monomers isolated by SEC from the refolded samples of the denatured monomer (red) and of the denatured HMW species (blue). The instrumentation and conditions were as described in . Each curve in (C) and (D) represents triplicate measurements averaged at each data point.
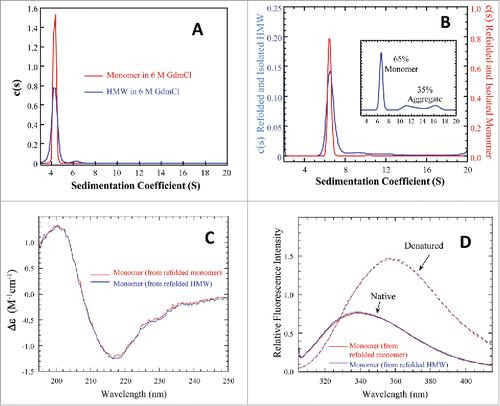
Table 1. Additional characterizations for comparison of mAb-PFM monomer and HMW species.
Figure 4. A: Schematic of the expected fragments resulting from papain digestion of IgG1 monomer and dimer associated via 2 Fab domains, one from each monomer. B: SDS-PAGE for the intact and the papain-digested fragments of mAb-PFM monomer and HMW species under the non-reducing (lanes 1–6) and the reducing (lanes 7–12) conditions. The fragments in the digests were fractionated by protein A column. Lanes 1 and 7: The protein A column flow-through fraction of the digested mAb-PFM monomer. Lanes 2 and 8: The protein A column eluted (Fc containing) fraction of the digested mAb-PFM monomer. Lanes 3 and 9: The protein A column flow-through fraction of the digested mAb-PFM HMW species. Lanes 4 and 10: The protein A column eluted fraction of the digested mAb-PFM HMW species. Lanes 5 and 11: Intact mAb-PFM monomer. Lanes 6 and 12: Intact mAb-PFM HMW species. The band identifications are as indicated in the figure. Invitrogen Novex Tris-Glycine 4–20% acrylamide gradient gel was used and the protein bands were stained with 0.05% Coomassie.
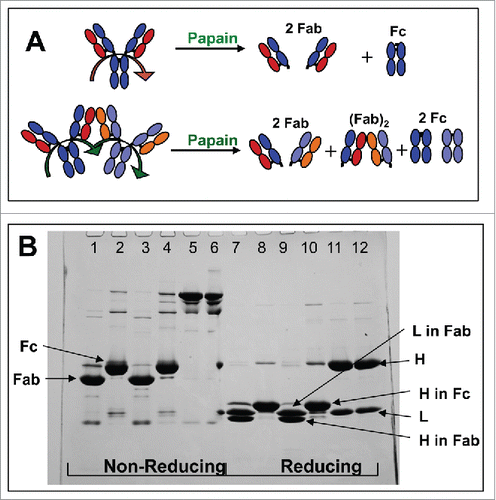
Figure 5. SE-HPLC analysis for the papain-digested fragments of mAb-PFM monomer and HMW species following the protein A column fractionation. (A and D) The intact mAb-PFM monomer and HMW species, respectively. (B and C) The protein A column flow-through and the eluted fraction, respectively, of the digested mAb-PFM monomer. (E and F) The protein A column flow-through and the eluted fraction, respectively, of the digested mAb-PFM HMW species. The mobile phase was PBS.
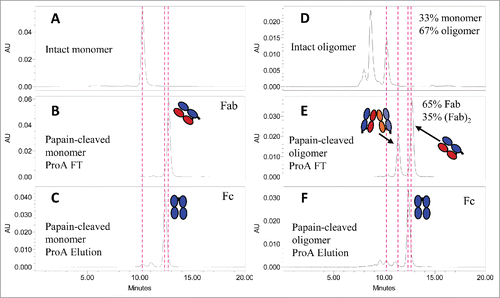
Table 2. Mass determination of the papain fragments.
Figure 6. In vitro binding capabilities of the Fcs and Fabs from papain-digested mAb-PFM monomer and HMW species, the (Fab)2 from papain-digested mAb-PFM HMW species, the (Fab’)2 from pepsin-digested mAb-PFM monomer, to the antigen of mAb-PFM by SPR (Biacore). The sensorgrams of the 2 Fc samples (isolated from the digests of monomer and HMW) and the 2 Fab samples (isolated from the digests of monomer and HMW) are respectively superimposable. All fragments were purified using protein A column followed by SE-HPLC. Each displayed sensorgram is the average of triplicate measurements, corrected for non-specific binding with a blank flow cell.
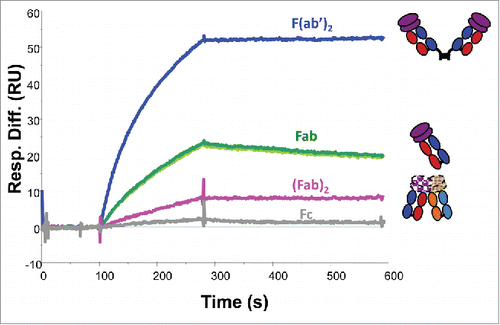
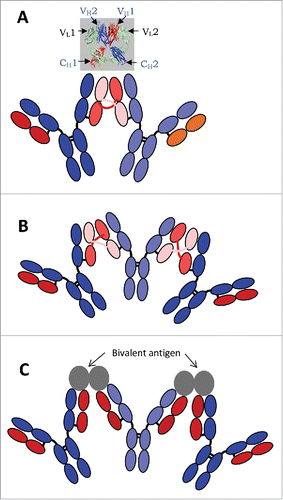
Figure 7. Schematic diagrams for IgG1 dimer (A) and trimer (B) formed via intermolecular domain exchange in the Fab domains, and for an immune complex of IgG1 with its bivalent antigen (C). The inset in (A) shows the crystal structure of the 2 Fab domains of a 2G12 antibody monomer with (intramolecular) exchanged heavy chains.Citation21