Figures & data
Figure 1. IgG binding to FcRn in the SPR assay. A. Sensorgram representing the binding of IgG molecules (as a series of concentrations) to FcRn at pH 6.0 and dissociating at pH 7.4. The variable region from mAb-1 was cloned onto wild-type heavy chain subclass IgG2 and injected over FcRn at 0, 31.3, 62.5, 125, 250, 500, 1000, or 2000 nM. B. Steady-state KD values at equilibrium were fit using Biacore software; the affinity of mAb-1 to FcRn in this experiment was 513.4 nM.
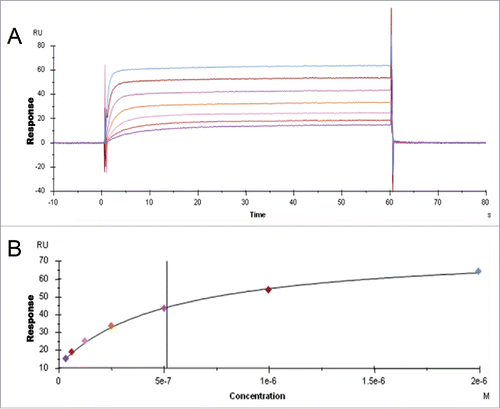
Table 1. Immobilized antigen-IgG complexes have reduced affinity for FcRn than uncomplexed IgG molecules. Steady-state KD affinity values were obtained from antigen-complexed IgG and uncomplexed IgG in SPR binding assays and values are listed for three IgG molecules.
Figure 2. IgG binding to FcRn using two orthogonal techniques. A. Bar graph plotting affinity of FcRn to three IgG molecules in the SPR and ITC assays. B. ITC Trace and model fit of an IgG molecule, mAb-7, that was contained in the syringe of the ITC instrument and incrementally injected into the cell containing FcRn. Model was fit using Origin software to the one site binding model. Software generated the following: Stoichiometry (N) 0.507 ± 0.00531 Sites (IgG:FcRn), Affinity (K) 3.51e6 ± 4.90e5 M−1, change in enthalpy (ΔH) −3525 ± 51.11 cal/mol and change in entropy (ΔS) 17.9 cal/mol/deg.
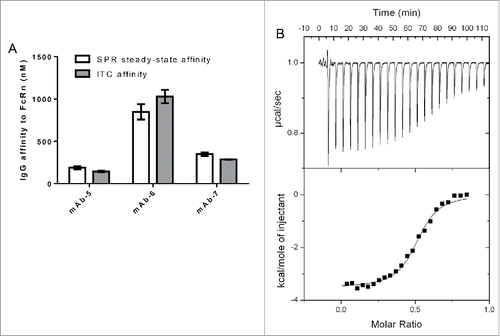
Table 2. Description of panels of IgG molecules tested to identify domains of IgG that affect affinity to FcRn. Steady-state KD affinity values to FcRn were determined using the SPR binding assay for panels of IgG molecules with distinct characteristics.
Figure 3. Heavy chain subclass does not alter the interaction of IgG to FcRn. IgG molecules from panel 1, with differing heavy chain subclasses, were tested for affinity to human FcRn in the SPR assay a minimum of three times on three different surfaces in three separate experiments. Mean steady-state KD values for each IgG molecule were plotted with error bars indicating standard deviations. Each set of IgG molecules, containing the same variable sequence and light chain subclass, is colored differently. Significant steady-state KD differences between IgG molecules within the same set were analyzed using an unpaired student t-test where significance is indicated as single asterisk (*) for p < 0.05.
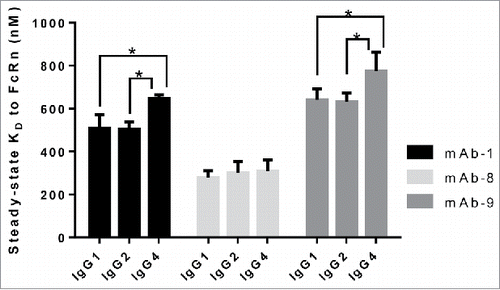
Figure 4. Light chain subclass does not alter the interaction of IgG to FcRn. IgG molecules from panel 2, containing kappa or lambda light chains all paired with the same heavy chain subclass (IgG1), was compiled and tested for affinity to FcRn in the SPR assay a minimum of two times in duplicate on two different surfaces in two separate experiments. The mean steady-state KD values for each IgG molecule were plotted with error bars representing standard deviations. Kappa and lambda containing IgG molecules are colored differently. Significant steady-state KD differences between IgG molecules with the same light chain isotype were analyzed using an unpaired student t-test where significance is indicated as single asterisk (*) for p < 0.05.
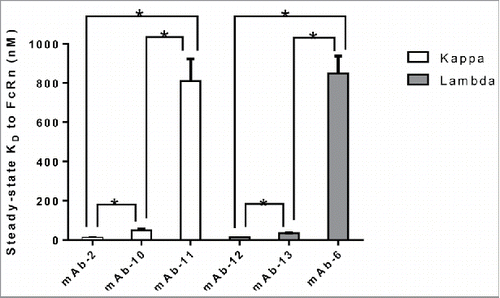
Figure 5. Variable domain FW family does not alter the interaction of IgG to FcRn. IgG molecules from panel 3, containing different variable domain FW families all paired with identical heavy and light chain subclasses, were compiled and tested for affinity to FcRn in the SPR assay a minimum of two times in duplicate on two different surfaces in two separate experiments. Mean steady-state KD values for each IgG molecule was plotted with error bars representing standard deviations. Different FW family containing IgG molecules are colored differently. Significant steady-state KD differences between IgG molecules with the same FW family were analyzed using an unpaired student t-test where significance is indicated as single asterisk (*) for p < 0.05. A. Heavy chain variable FW domain families VH1 and VH3. B. Light chain variable FW domain families VK1 and VK2, and VL1 and VL3.
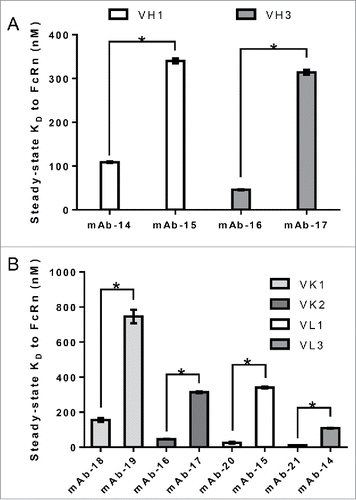
Figure 6. CDR sequences can alter the binding affinity of IgG to FcRn. Mean steady-state KD values for each IgG molecule in panel 4 were plotted with error bars representing standard deviations. Each IgG molecule contains identical constant domains and FW residues, but different CDR sequences.
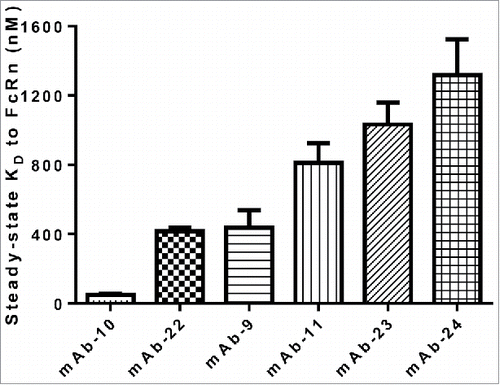
Table 3. Small variations in CDRs alter affinity of IgG to FcRn. IgG molecules in panel 5, differing only by 1–5 mutations in CDR sequences, were tested for affinity to FcRn in the SPR assay.
Figure 7. No binding is observed between the Fab domain and FcRn. Variable domains from mAb-10 were cloned onto IgG1 subclass with mutations in the two key histidine contact residues to ablate the interaction between the Fc regions of IgG and FcRn. No interaction was measured after injecting these IgG molecules at maximum concentrations just over sixty times the steady-state KD of the wild type IgG1 molecule.
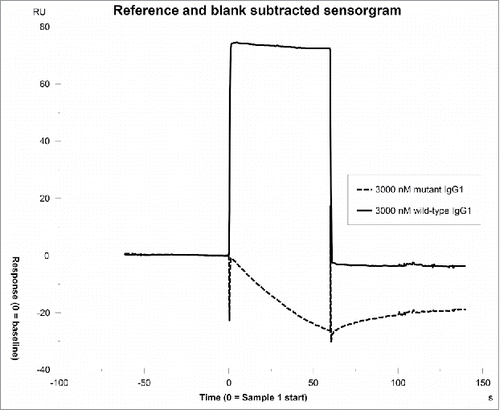
Figure 8. Correlation of various pI values with affinity to FcRn. pI values were calculated for the entire IgG, variable regions and each individual CDR for the IgG molecules in panel 4, which differ by CDRs only. pI values of variable regions (r = −0.85), CDR- L1 (r = −0.82) and L3 (r =−0.88) all correlate with their corresponding affinity to FcRn. No correlation was observed with pI of CDR-L2 (r =−0.53), H1 (r =−0.25), H2 (r =−0.66) or H3 (r =−0.70).
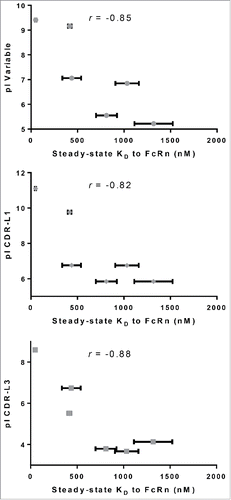
Figure 9. Higher pI values of CDR-L3 correlates with higher affinity to FcRn. Plotting the steady-state KD vs. pI of variable regions and CDR-L3 for a subset of IgG molecules from panel 5 that differ by only one amino acid residue in CDR-L3 (mAb-25, 26, 27, 38 and 42) demonstrated a strong correlation between higher pI value and higher affinity to FcRn for variable regions (r =−0.99) and CDR-L3 (r =−0.91).
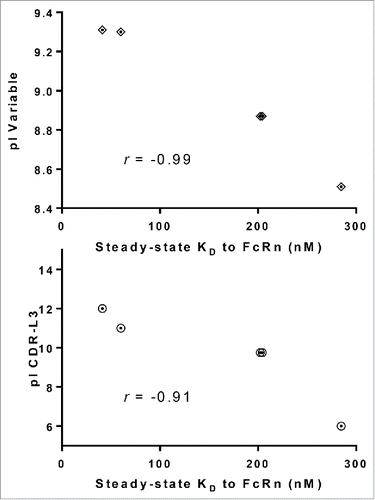
Figure 10. Model of IgG binding to FcRn. FcRn is a heterodimer consisting of a MHC-class-I-like heavy chain, FcRn (shown in green) and a β2 m light chain (shown in red). The transmembrane domain is drawn in through a cartoon of the endosomal membrane. The figure displayed is modeled on the crystal structure of rat FcRn binding rat IgG2a Fc (PDB ID: 1FRT11) superimposed with modeled IgG1 based on the crystal structure of IgG1 (PDB ID: 1HZH). In this model, the right side of the Fc of IgG1 heavy chain (shown in grey) is binding to FcRn. One of the Fab arms (shown in yellow with CDRs in pink) is facing towards the endosomal membrane.
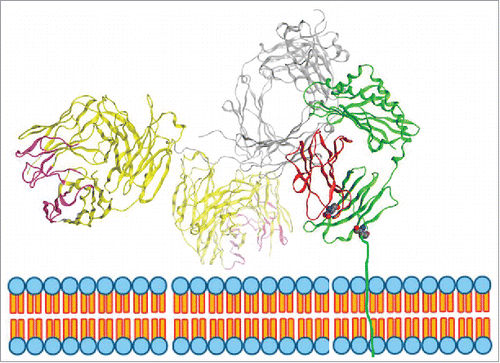
Figure 11. Presence of the carboxymethyl dextran matrix and constraining the Fab domain of IgG molecules by binding to antigen alters steady-state KD to FcRn. The FcRn SPR binding assay was carried out on SA and NA chips with a carboxymethyl dextran matrix, on NA coated on a C1 chip with no matrix and on IgG molecules captured on antigen for the five IgG molecules from panel 6 that vary by 1–3 amino acid residues in CDRs only on at least three experiments on a minimum of two different surfaces. Significant steady-state KD differences between IgG molecules tested with or without matrix were analyzed using an unpaired student t-test where significance is indicated as single asterisk (*) for p < 0.05.
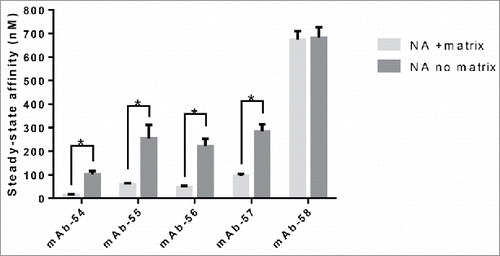
Table 4. CL values for the set of IgG molecules from panel 6, which differ by 1–3 amino acid residues in CDRs only, show big variation in CL (mL/hr/kg). hFcRn Tg32 homozygous mice were IV dosed with 5 mg/kg of mAb. For mAb-54, the last two timepoints were excluded from PK parameter calculation due to presumed TMDD or ADA. In vitro affinity to FcRn, location and number of mutations, and pI values of variable and CDR-L3 are also listed for each IgG molecule.
Figure 12. Mutations in CDRs can alter in vivo CL of IgG molecules. Plasma concentrations from hFcRn Tg32 homozygous mice were plotted over time for IgG molecules from panel 6, a set of five IgG molecules that vary by 1–3 amino acid residues in CDRs only. For mAb-54, the asterisks (*) indicate timepoints excluded from PK parameter calculation due to presumed TMDD or anti-drug antibody (ADA).
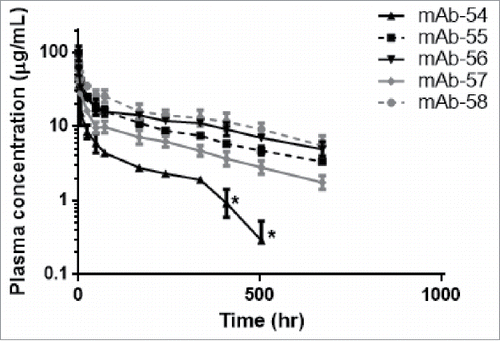
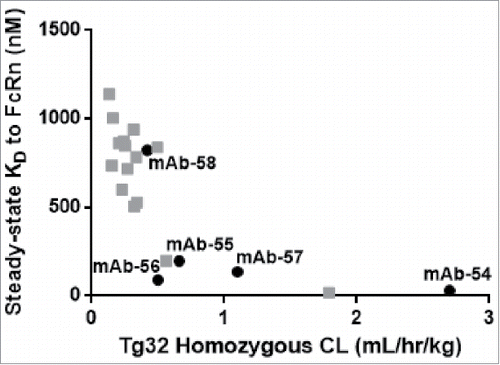
Figure 13. In vitro affinity to FcRn correlates with in vivo CL of IgG molecules. Plotting the hFcRn Tg32 homozygous CL vs. the steady-state KD for the set of five IgG molecules from panel 6 that vary by 1–3 amino acid residues in CDRs only (mAb-54–58, in black) and twenty-one additional IgG molecules (gray) demonstrated a correlation between in vitro affinity to FcRn and in vivo CL (r =−0.79).
