Figures & data
Figure 1. Host NK cells regulate CD8 T cell-mediated cytotoxic responses in vivo against bm1 hematopoietic target cells.
Naïve B6 mice were treated at day 0 and day 7 with 1 mg/mouse of isotype control (red bars), anti-NK1.1 antibody (black bars) or anti-CD8 antibody (blue bars). The same day, the three groups of mice were injected with CFSE-labeled female bm1 splenocytes (15 × 10Citation6 splenocytes). The absolute number of bm1 hematopoietic cells remaining in spleen and peripheral lymph nodes (pLNs) (inguinal plus axillary and brachial) was evaluated at day 5, 9 and 15 after cell transfer. Results are expressed as mean ± SD and the data comes from a pool of two experiments with three mice per experimental group.*, p < 0.05; **, p < 0.005; ***, p < 0.0005 were considered statistically significant.
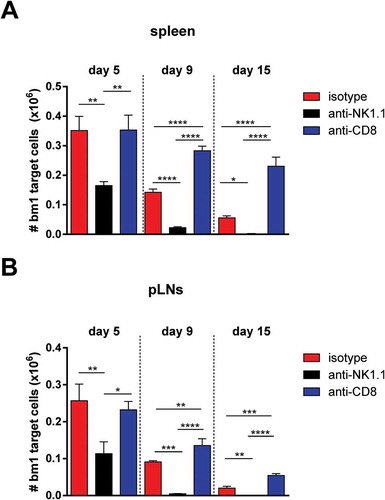
Figure 2. Depletion of NK cells accelerates bm1 skin allograft rejection in both CD8 T cell replete and CD8 T cell-depleted B6 recipients.bm1 skin allografts placed on B6 recipients were followed for 40 days after transplantation. C57BL/6 recipient mice were treated at day 0 and day 7 with 1 mg of either isotype control or anti-NK1.1 depleting antibody (A), or with anti-CD8 mAb or anti-CD8 mAb plus anti-NK1.1 mAb (B). The survival curve was plotted following the Kaplan–Meier life table method and the statistical analysis was performed using the long-rank test. The survival curve is the global result of a pool of 6 experiments. Visual macroscopic inspection of the bm1 skin grafts (C) and hematoxylin and eosin (H/E) staining of skin tissue sections (D) of the four experimental groups are depicted at day 13 and day 21 post-Tx. bm1 skin graft rejection occurred at day 13 post-Tx in NK cell depleted recipients and at day 21 post-Tx in CD8/NK cell depleted recipients few days in advance than in isotype control or anti-CD8 T cell depleted mice, respectively. Severe rejection of donor bm1 tail skin was accompanied with necrosis of donor epithelium and intense dermal mononuclear infiltration. Black dotted ellipse highlights massive necrosis of skin epithelium and dermis underneath of donor bm1 skin graft in the tissue section. Statistical significance is indicated as follows: *p < 0.05, **p < 0.005, ***p < 0.0005, and ns, non-significant.
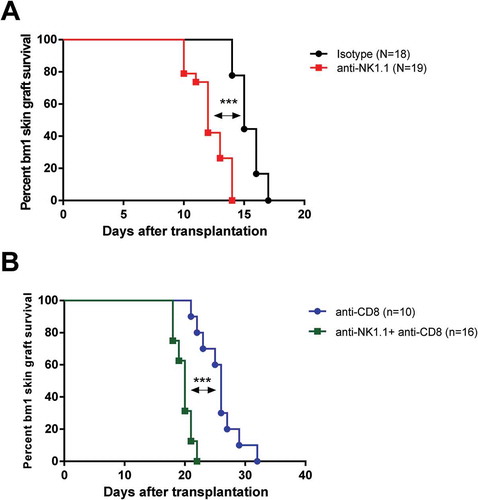
Figure 2. (Continued).
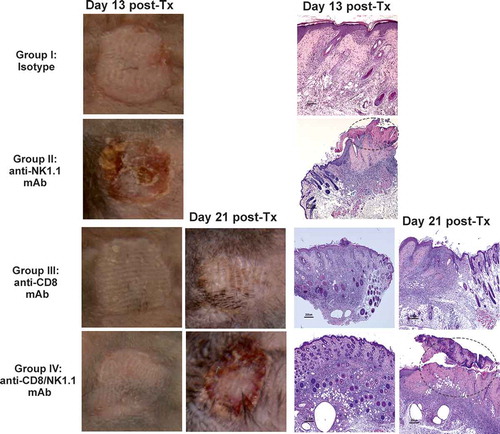
Figure 3. NKT cell and NK cell expansion in draining pLNs during the course of graft rejection in both CD8 T cell replete and CD8 T cell-depleted recipients.Non-draining and draining axillary and brachial pLN from each experimental group of bm1 skin-grafted B6 recipients were collected at two time points after transplantation. The absolute number of NKT (DX5+CD3+) cells, non-T NK cells (DX5+CD3− cells and DX5+NKp46+ cells) was quantified at day 13 (left side panel) and day 21 (right side panel) post-Tx. Results are displayed as mean ± SD. Statistical significance and p value was calculated using unpaired Student’s t test for the comparison of means between draining versus non-draining pLN in each experimental group. One way ANOVA was applied for the comparison of means among experimental groups within non-draining or draining pLNs. The following criterion of statistical significance was used: *, p < 0.05; **, p < 0.005; ***, p < 0.0005. These plots display data pooled from three independent experiments with three mice per group.
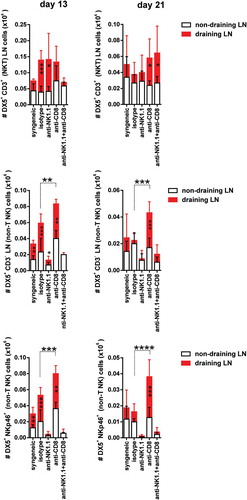
Figure 4. Expansion of CD4 T cells and CD8 T cells in draining pLNs of B6 mice after skin transplantation across an MHC class I barrier.
Non-draining and draining axillary and brachial pLNs from each experimental group of bm1-skin grafted B6 recipients were collected at two time points after transplantation.The absolute number of CD8 T cells (upper panels) and the absolute number of CD4 T cells (lower panels) at day 13 and day 21 post-Tx is depicted in draining and non-draining lymph nodes. Results are displayed as mean ± SD. Statistical significance and p value was calculated using unpaired Student’s t test for the comparison of means between draining versus non-draining pLN in each experimental group. The following criterion of statistical significance was used: *, p < 0.05; **, p < 0.005; ***, p < 0.0005. These plots display data pooled from three independent experiments with three mice per group.
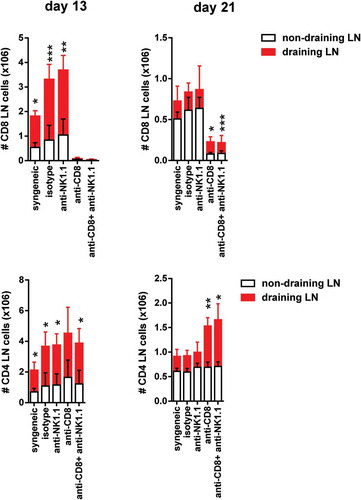
Figure 5. Increased of CD8 T cells and CD4 memory type T cell numbers in draining pLNs of B6 mice after skin transplantation across an MHC class I barrier.The absolute number of CD8 and CD4 TEM cells at day 13 post-Tx (upper left panel) (A) and day 21 post-Tx (upper right panel) (B) and the absolute number of CD8 and CD4 TCM cells at day 13 post-Tx (lower left panel) (A) and day 21 post-Tx (lower right panel) (B) is depicted in non-draining and draining lymph nodes. Results are displayed as mean ± SD. Statistical significance and p value was calculated using unpaired Student’s t test for the comparison of means between draining versus non-draining pLN in each experimental group. The following criterion of statistical significance was used: *, p < 0.05; **, p < 0.005; ***, p < 0.0005. These plots display data pooled from two independent experiments.
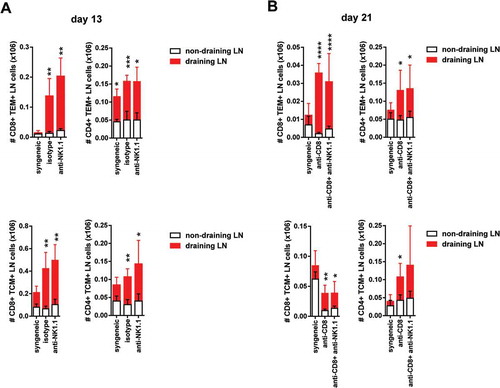
Figure 6. NK cell depletion augmented in vivo CTL activity of skin-grafted sensitized allogeneic CD8 T cells against bm1 hematopoietic target cells.bm1 skin-grafted B6 recipients were challenged with CFSE-labeled target bm1 cells at day 13 (time of rejection for NK cell-depleted group) and day 21 (time of rejection for CD8/NK cell-depleted group) after Tx. The killing of bm1 hematopoietic target cells was evaluated as the total cell counts of bm1 cells remaining in spleen (A) and pLNs (B) 24 hours after i.v. injection of 15 × 10Citation6 of CFSE-labeled bm1 target splenocytes at day 13 and day 21 after Tx. Results are displayed from one representative experiment out of two with three mice for each experimental group. Results are displayed as mean ± SD. *, p < 0.05; **, p < 0.005; ***, p < 0.0005 were considered statistically significant.
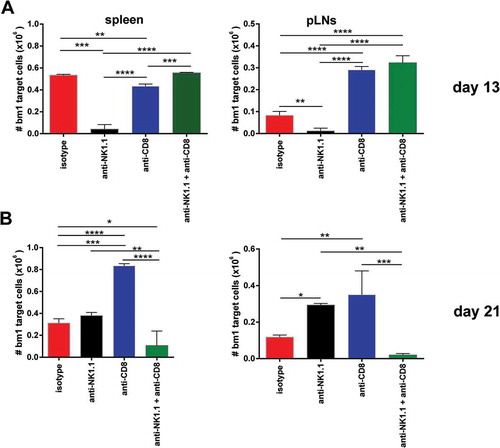
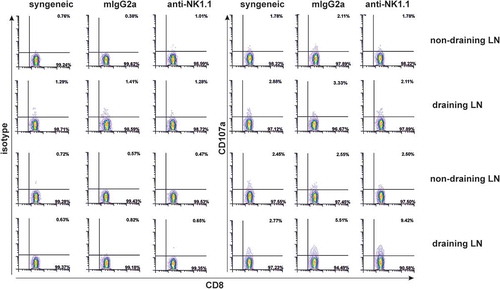
Figure 7. NK cell depletion increases donor alloantigen specific CD8+ T cells expressing CD107a.At the time of rejection initiation in NK-cell depleted mice, 1.5 × 10Citation5 cells from non-draining and draining pLNs (axillar and brachial) were isolated from syngeneic or allogeneic bm1 skin grafted treated either with isotype control or anti-NK1.1 antibody. Then, syngeneic and allogeneic lymphocytes were re-stimulated in vitro with 0.5 × 10Citation5 allogeneic syngeneic control and bm1 allogeneic mature BM-DC per well for 1 hour in the presence of PE-conjugated isotype control or PE-conjugated anti-CD107a mAb. Finally, the Golgi plug monensin was added and incubated 4 more hours. This figure is a representative experiment of two performed with similar results using one mouse/experimental group/experiment.