Figures & data
Figure 1. Representative gradient 2 and the base peak chromatogram of the denosumab tryptic peptides on ERLIC-MS/MS.
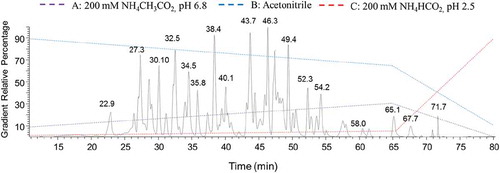
Figure 2. 2D presentation of ERLIC-MS/MS based peptide mapping of denosumab tryptic peptides (gradient 2).
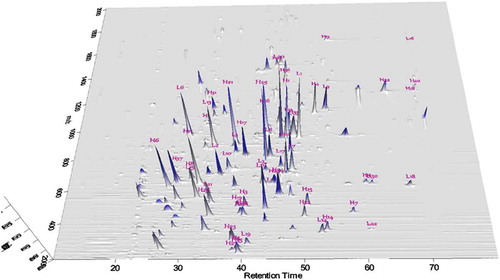
Table 1. The characterization of major variant peptides of denosumab (gradient 2).
Figure 3. Representative chromatograms and mass spectra of terminal peptides (gradient 2). (A) The extracted ion chromatograms of N-terminal peptide of heavy chain; (B) The MS2 mass spectra of N-terminal peptide of heavy chain.
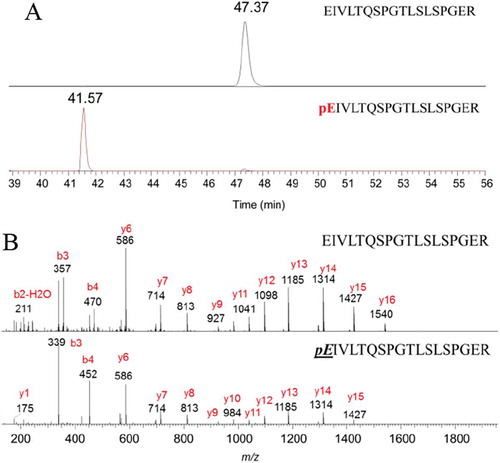
Figure 4. Representative chromatograms and mass spectra of methionine-containing peptides H17 and its oxidized form (gradient 2).
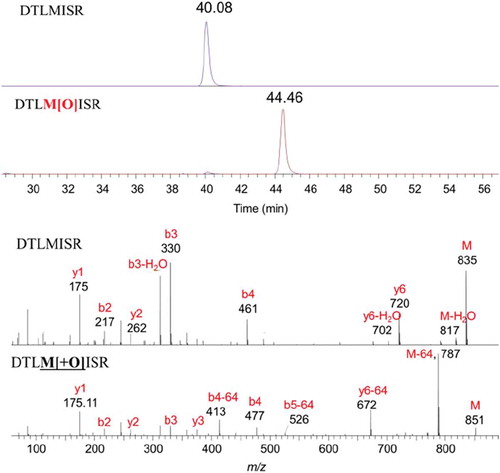
Figure 5. (A) The separation of non-deamidated and deamidated peptides of “GFYPSDIAVEWESNGQPENNYK” in gradient 1. (B) The MS2 fragment ion mass spectra analysis of labelled peaks.
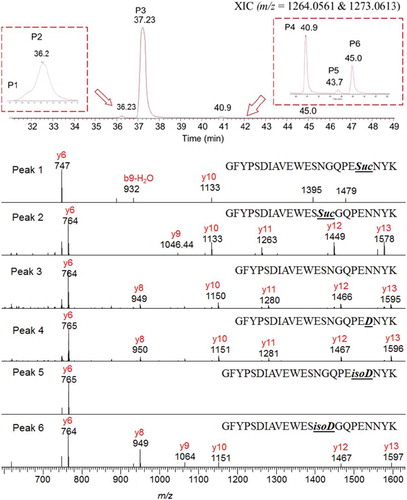
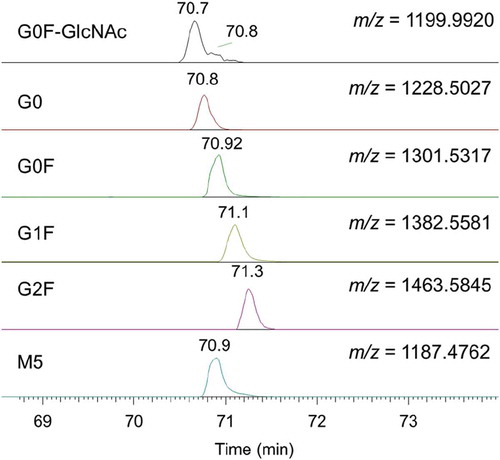
Figure 6. The extracted ion chromatograms of major glycopeptides in monoclonal antibody denosumab (gradient 2).