Figures & data
Table 1. Kinetic parameters for cell growth, protein production and lactate calculated from the 8-day short duration fed-batch study with GS CHO1 cell line.
Figure 1. CHO1 cell growth (A), metabolite profiles: glucose (B), glutamine (C), glutamate (D), and lactate (E), and mAb1 production: titer (F) and specific productivity qP (G) in fed-batch production in 250-mL shake flasks at different constant temperatures of 32, 33, 34, 35, and 36.5 ºC with a high initial VCD of 10 × 10Citation6 cells/mL for an 8-day short duration. The dots denote the experimental data with the average of duplicate runs (n = 2) and the lines represent the simulation results.
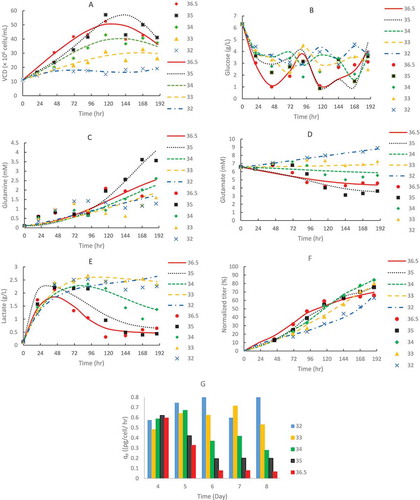
Table 2. Predicted mAb1 titer (normalized) for different TS conditions via kinetic models from the 8-day short duration fed-batch study, assumed that the GS CHO1 cell cultures would be inoculated at a typical VCD of 0.6 × 10Citation6 cells/mL with an initial temperature of 36.5 °C, then downshift to different temperatures for a 14-day full duration. The validated titer (normalized) values were from the GS CHO1 cell cultures described in . The 8 conditions with bold produced high titer values ≥97%.
Figure 2. CHO1 model validation for VCD (A), titer (B) and specific productivity (C) in fed-batch production 250-mL shake flasks with TS from 36.5 to 33 or 34 °C on different days using a typical initial VCD of 0.6 × 10Citation6 cells/mL for a 14-day full duration. The dots denote the experimental data with the average of duplicate runs (n = 2) and the lines represent the computing results using the kinetic models from the 8-day short-duration study.
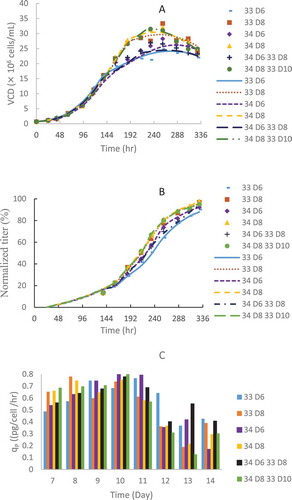
Figure 3. CHO2 cell growth (A) and metabolite profiles: glucose (B), glutamine (C), glutamate (D), lactate (E) and ammonium (F) in batch production 5-L bioreactors at different constant temperatures of 33, 34, 35, 36.5, 37.5 and 38.5 ºC with an initial typical VCD of 0.6 × 10Citation6 cells/mL for a 4-day short duration. The dots denote the experimental data (n = 1) and the lines represent the simulation results.
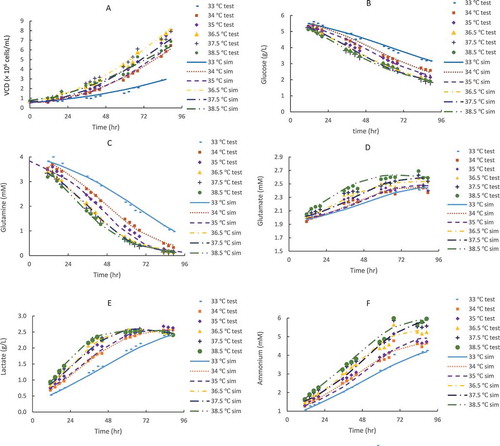
Figure 4. CHO2 model validation for cell growth (A) and metabolites: glucose (B), glutamine (C), glutamate (D), lactate (E) and ammonium (F) in fed-batch production 5-L bioreactors (n = 3) with TS from 36.5 to 35 °C on day4 using an initial typical VCD of 0.6 × 10Citation6 cells/mL for a 14-day full duration. The dots denote the experimental data for a 14-day full duration and the lines represent the computing results for first 10-day duration using the kinetic models from the 4-day short duration study.
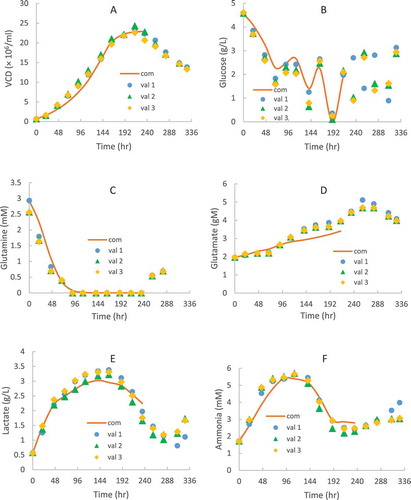
Figure 5. VCD profiles prediction of CHO2 at different TS conditions with a typical initial VCD of 0.6 × 10Citation6 cells/mL: TS from 36.5 °C to 35, 34 and 33 °C on day 4 (A); TS from 36.5 °C to 33 °C on day 4, day 6 and day 8 (B). M represents a multiple temperature shifting steps: TS from 36.5 °C to 35 °C on day 4, then to 34 °C on day 6, and finally to 33°C on day 8. The lines represent the computational prediction results using the kinetic models from the 4-day short-duration study.
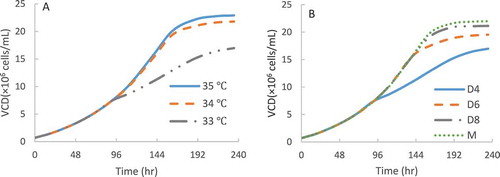
Table 3. Kinetic parameters for cell growth and lactate calculated from the 4-day short duration batch study with DG44 CHO2 cell line.
Figure 6. Effect of different constant temperatures on CHO2 for mAb2 specific productivity (A) and quality attributes: SEC profile (HMW: B) and charge variants (Acidic: C, Basic: D) in batch 125-mL shake flasks with a high initial VCD of 10 × 10Citation6 cells/mL for a 2-day short duration (n = 2).
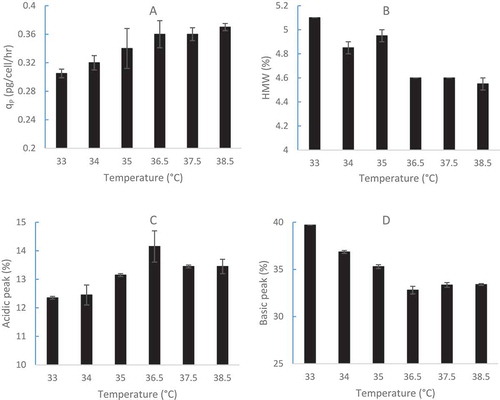
Figure 7. Effect of different TS conditions on mAb2 specific productivity (qP values were calculated from day6 to day10) (A) and final D14 quality attributes: SEC profile (HMW: B) and charge variants (Acidic: C, Basic: D) in fed-batch production 5-L bioreactors (n = 2) with an initial temperature of 36.5 °C, then reduced to 35, 33.5 or 32 °C from day5 to day14 using a typical initial VCD of 0.6 × 10Citation6 cells/mL for a 14-day full duration.