Figures & data
Figure 1. Illustration of antibody formats in the present study. Yellow represents the variable region of Ab1, orange represents the variable region of Ab2, and blue represents constant regions. “r:” represents recombinantly linked formats, and “c:” represents chemically coupled formats. r:Fv-IgG variable domains were linked recombinantly using a 10-residue Gly-Ser linker (GGGGSGGGGS), r:Fab-IgG Fabs were linked recombinantly using a 7 residue Gly-Ser linker (GGGGSGG), and coupled formats c:Fab-IgG and c:IgG-IgG were linked with thiol chemistry through a bis-maleimido polyethylene glycol (BMPEG) linker containing 3 PEG units. The labels above the formats provide arbitrary designations for the monoepitopic (left hand side) and biepitopic (right-hand side) versions of each format. The bracketed formats were not characterized in the present study but are included in the illustration for completeness.
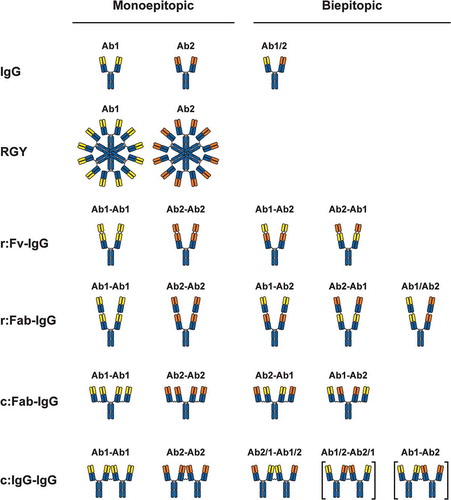
Figure 2. Tetravalent biepitopic antibody formats enable intrinsic agonism of TNFRSFs. (a) NF-κB signaling mediated by OX40L-huIgG1 Fc fusion (OX40L) and anti-OX40 antibody formats. IgG1 (squares) and OX40L (downward triangles) were tested with (+XL) and without extrinsic secondary crosslinking. Orange triangle represents a bivalent biepitopic antibody (Ab1/Ab2), and upward triangles represent hexameric variant antibodies (RGY). (b–e) OX40 NF-κB signaling activity mediated by tetravalent biepitopic (blue) and monoepitopic (red) antibody formats: r:Fv-IgG (b), r:Fab-IgG (c), c:Fab-IgG (d) or c:IgG-IgG (e). (f) DR5 driven caspase-8 activity and (g) anti-proliferative activity in COLO 205 cells mediated by multivalent and multiepitopic antibody formats and soluble Flag-Apo2L. For all tetravalent formats (b–g) blue circles indicate biepitopic formats and red diamonds indicate monoepitopic formats, respectively. The x-axis for each graph represents the molar concentration of each complete molecule irrespective of number of receptor binding units; i.e., 1 nM of a bivalent antibody has two binding sites, whereas a 1 nM equivalent of an r:Fv-IgG has four binding sites.
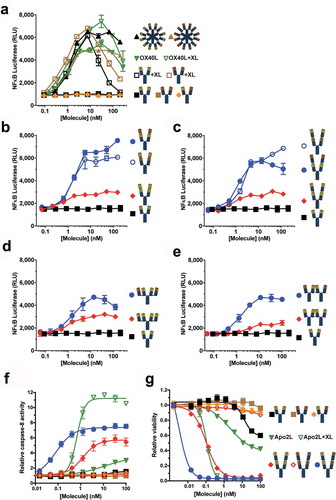
Figure 3. Tetravalent biepitopic targeting enables T cell activation without extrinsic crosslinking and obviates requirement for CD28 co-signal. (a–d) Co-stimulation of CD3-activated primary human CD4+ T cells by anti-OX40 IgG1 (a and c) and Fc attenuated LALAPG (b and d) versions of r:Fv-IgG in the presence of co-cells expressing FcγRIIa and B7-1 (FcγRIIa+ B7-1+) (A and B) or FcγRIIa alone (FcγRIIa+ B7-1−) (c and d). (e) Provision of CD28 signal (B7-1+) augments OX40 expression on T cells. Primary human CD4+ memory T cells were co-cultured with B7-1− (black) or B7-1+ (red) L cells over time. (f and g) Co-stimulation of primary human CD4+ T cells by hexameric anti-OX40 antibodies in the presence of FcγRIIa+ B7-1+ (f) or FcγRIIa+ B7-1− co-cells (g). Closed symbols represent IgG1 versions and open symbols represent Fc attenuated LALAPG versions for both IgG1 (black) and RGY (brown) versions. (h–j) Co-stimulation of primary human CD4+ T cells by IgG1 versions of tetravalent monoepitopic and biepitopic formats r:Fab-IgG (h), c:Fab-IgG (i), and c:IgG1-IgG (j) in the presence of FcγRIIa+ B7-1− co-cells. For data on all tetravalent formats (a–d, h–j), blue circles indicate biepitopic formats and red diamonds indicate monoepitopic formats, respectively, black squares indicate Ab1 IgG1, and brown triangles indicate Ab1 IgG1 RGY comparators. The x-axis for each graph represents the molar concentration of each complete molecule irrespective of number of receptor binding units; i.e., 1 nM of a bivalent antibody has two binding sites, whereas a 1 nM equivalent of an r:Fv-IgG has four binding sites. Y-axes are scaled the same for samples run in the same internally controlled experiment (same blood donor, same 7-day culture) as follows: (a–d) were executed in the same experiment, (f–g) were executed in the same experiment, and (h–j) were executed in the same experiment. RGY IgG1 (solid gold triangles) was used as a standard for comparison of results across different experiments.
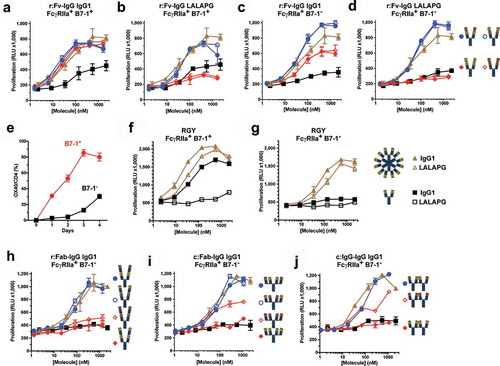
Figure 4. Tetravalent biepitopic targeting promotes higher order immune complexes. (a) SEC chromatograms for native IgG1 Ab1 (black) and Ab2 (brown), r:Fv-IgG biepitopic (blue), and r:Fv-IgG monoepitopic (red) antibodies in the absence (top graph) or presence (bottom graph) of OX40 ECD protein. (b) Size of the largest antibody/OX40 complex calculated by SEC-MALS. Biepitopic IgG1 (right-most blue bar) represents the bivalent biepitopic IgG Ab1/Ab2 illustrated in . (c) Immunofluorescence microscopy of anti-CD3 stimulated primary T cells following binding of 6.7 nM anti-OX40 antibodies on ice, fixation, and detection with Cy3-conjugated anti-human antibody. The assay was conducted on ice to prevent internalization or degradation, and thus the data reflect only differential binding and clustering of the antibody formats on the cell surface. Binding specificity was evidenced by lack of signal on stimulated T cells with an isotype IgG control (upper right), and by r:Fv-IgG on unstimulated (OX40-negative) T cells (lower right). IgG1 (upper left) and RGY (lower left) represent Ab1 IgG1 and Ab1 RGY antibodies, respectively. (d and e) Crystallographic structure of ternary complex of OX40 bound by Ab1 and Ab2 Fabs. (d) Crystallographic structure of Ab1 (green/ivory) and Ab2 (navy/gold) Fabs bound to OX40 (red). Spheres mark the C-termini of the heavy chain components where attachment to the hinge region would occur in the context of a full-length IgG, and the distance (114 Å) between those two C-termini is labeled. Epitopes are shaded on the molecular surface in tan (Ab1) and light blue (Ab2). For the presented OX40 orientation the cell membrane would be at the lower side of the image. (e) “Top down” view of the ternary complex with Ab1 and Ab2 Fabs rendered in molecular surface bound to the OX40 ECD in red. The OX40:OX40L trimer (OX40 in orange, OX40L in magenta) derived from PDB 2HEV has been superposed by alignment of the OX40 chain (the aligned 2HEV OX40 is not shown for clarity), indicating extensive steric clash between either of the Fabs and the physiological trimeric OX40L arrangement.
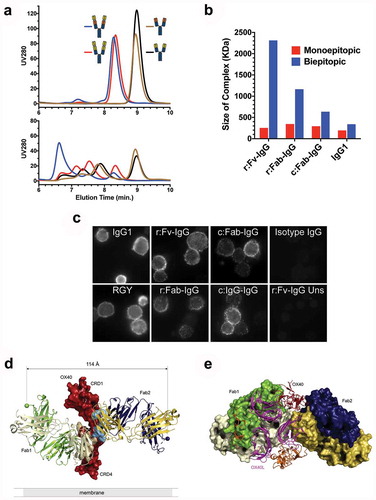
Table 1. Data collection and refinement statistics for OX40:Fab binary and ternary complexes.
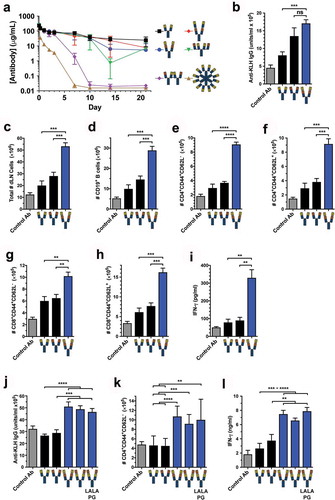
Figure 5. Tetravalent biepitopic OX40 targeting enables superior in vivo pharmacodynamic activity. (a) PK of native IgG1, tetravalent formats, and RGY hexamer in C57BL/6 mice at 10 mg/kg i.v. dose. Data are mean and SD, n = 3/time point/group. (b–e) Pharmacodynamic activity of native IgG1 and biepitopic r:Fv-IgG (Ab1-Ab2 orientation) antibodies in response to KLH-immunization in hOX40ki mice. Control Ab represents immunization with CFA/KLH and anti-gD human IgG1. (b) Anti-KLH IgG in serum on day 14 post immunization measured by ELISA. (C-H) Flow cytometry was used to determine on day 20 total draining lymph node (dLN) cells (c), CD19+ B cells (d), effector memory (CD44+ CD62L−) CD4+ T cells (e), central memory (CD44+ CD62L+) CD4+ T cells (f), effector memory CD8+ T cells (g), and central memory CD8+ T cells (h). (i) KLH-specific recall response was measured by in vitro stimulation of dLN cells with KLH; interferon gamma (IFN-γ) production was assessed in the supernatant after 5 days by luminex. (j–l) In a separate in vivo experiment, an expanded set of r:Fv-IgG antibodies was tested that included both Fv orientations (Ab1-Ab2 and Ab2-Ab1) and the Fc attenuated LALAPG version of the Ab2-Ab1 r:Fv-IgG. (J) Anti-KLH IgG in serum on day 14 post immunization measured by ELISA. (k) Number of effector memory CD4+ T cells on day 20. (l) IFN-γ production from ex vivo KLH-stimulated dLN cells. ****P < .0001; ***P < .001; **P < .01; ns = not significant (P > .05); Two-tailed P values from unpaired t-test. For PD experiments all data are mean and standard error of the mean (SEM); for the experiment presented in (b–i) n = 3 for Control Ab and n = 5 for all other antibody test articles; for the experiment presented in (j–l) n = 8 for all test articles.