Figures & data
Table 1. Preclinical in-vitro and in-vivo datasets used to develop the proposed translational PK-PD model
Figure 1. (A) A schematic diagram of a cell-level pharmacodynamic model for CAR-T cell activity: A dynamic population of CAR-T cells and tumor cells was assumed in an in-vitro system. Upon target-mediated interaction among the two-cell population, there is formation of CAR-Target complexes, which simultaneously mediate the tumor cell depletion, expansion of CAR-T cells and release of cytokines. (B) A schematic diagram of a physiologically based pharmacokinetic (PBPK) model to characterize the disposition of CAR-T cells: The model is compartmentalized into blood and relevant tissues, anatomically arranged via blood flows (red arrows) and lymphatic flows (green arrows). Each tissue is further sub compartmentalized into vascular and extravascular spaces. A 1st order elimination of CAR-T cells (solid black arrow) is characterized from liver extravascular space. In a typical tissue, CAR-T cells extravasates from vascular to extravascular space via 1st order transmigration (JOrgan) rates, eventually circulating back to blood stream via organ-specific lymphatic flow. Within the tumor extravascular space, there is formation of CAR-Target complexes, whereas only unbound CAR-T cells can circulate back via lymphatic flow. (C) A schematic diagram of PBPK-PD model to characterize CAR-T cell expansion and tumor growth inhibition: The diagram illustrates only the ‘tumor compartment’ of the full PBPK model structure, where upon formation of CAR-Target complexes in tumor extravascular space, there is expansion of total (unbound + tumor-bound) CAR-T cells and depletion of total tumor volume (TVtotal), which comprises vascular and extravascular spaces. Only the unbound CAR-T cells can leave the tumor tissue via lymphatic (LTumor) flows. The ‘number of CAR-Target complexes per tumor cells’ undergo a series of signal transduction steps (K1-K4), before they ultimately induce killing of inherently growing tumor cells (Kg) to induce TGI
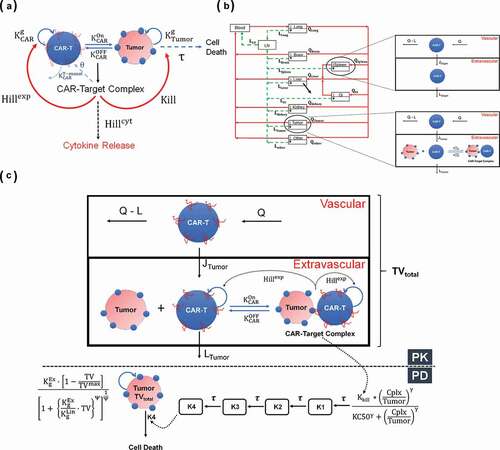
Figure 2. Observed and model fitted profiles for affinity variant anti-EGFR CAR-T cells activity in an in-vitro system. (A) Target cell killing: Observed (in dots) and model-generated (solid lines) profiles of viability of EGFR expressing parental U87 cell lines with varying antigen-densities (30,899–628,265 receptors/cell), upon incubation with either low affinity nimotuzumab CAR-T (in blue) or high affinity cetuximab CAR-T (in red). Figures A1 and A2 describes the cell-viability as a function of time, whereas figures A3-A6 describes the viability as a function of different E:T ratios after incubation of CAR-T cells at 4h. (B) CAR-T cell proliferation: Observed (in dots) and model-generated (solid lines) profiles of untransduced (in black) or high affinity cetuximab CAR-T cells (in red) growth kinetics, when cocultured with EGFR expressing U87 (30,899 receptors/cell) cells at an E:T ratio of 1:2. (C) Cytokine release: Observed (in dots) and model-generated (solid lines) profiles of % IFN-γ release after coculture of high affinity cetuximab CAR-T (in red) or low affinity nimotuzumab CAR-T cells (in blue) with EGFR-expressing U87 parental cell lines with varying antigen densities (30,899–628,265 receptors/cell). Figure C1 describes the extent of % INF-γ release as a function of antigen-density, whereas figures C2 and C3 describes the time-course of %IFN-γ release as a function of time
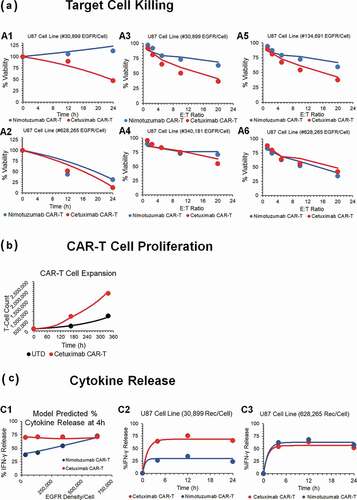
Table 2. Parameters, either fixed or estimated, used to build the PBPK-PD model for CAR-Ts
Figure 3. Observed and model fitted profiles for affinity variant anti-HER2 CAR-T cells activity in an in-vitro system. (A) Target cell killing: Observed (in dots) and model-generated (solid lines) profiles of % cytotoxicity (at 8h) of NALM-6-CBG cells transiently transfected with 0.1 (green), 1 (red) and 10 (blue) µg of HER2 mRNA respectively and cocultured with affinity variant anti-HER2 CAR-Ts, i.e., 4D5 (Kd = 0.58 nM, fig A1), 4D5-7 (Kd = 3.2 nM, fig A2), 4D5-5 (Kd = 1.1 µM, fig A3) and 4D5-3 (Kd = 3.9 µM, fig A4) respectively, as a function of varying E:T ratios. (B) CAR-T cell proliferation: Observed (in dots) and model-generated (solid lines) profiles of fold-expansion of affinity variant anti-HER2 CAR-T cells, i.e., 4D5 (Kd = 0.58 nM, fig B1), 4D5-7 (Kd = 3.2 nM, fig B2), 4D5-5 (Kd = 1.1 µM, fig B3) and 4D5-3 (Kd = 3.9 µM, fig B4) respectively, as a function of antigen densities on HER2 expressing K562 cells cocultured at E:T ratio of 1:1 for 7 d. (C) Cytokine release: Observed (in dots) and model-generated (solid lines) profiles of IFN-γ release (pg/mL) as a function of different HER2 densities on K562 cells, when cocultured with CAR-T cells at E:T ratios of 1:1 for 24h. Figures C1 and C2 describes the cytokine release for high-affinity 4D5 CAR-T (Kd = 0.58 nM) with lower (fig. C1) and higher (fig. C2) CAR densities, respectively. Figures C3 and C4 describes the cytokine release for low-affinity 4D5-5 CAR-T (Kd = 1.12 µM) with lower (fig. C3) and higher (fig. C4) CAR densities, respectively
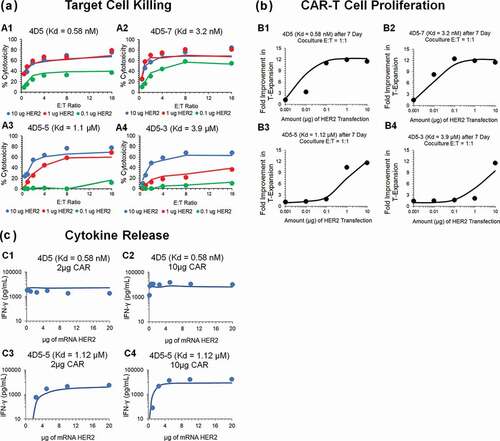
Figure 4. Observed and model fitted profiles for biodistribution of CAR-T cells in xenograft mouse model. (A and B) Observed (in dots) and model-generated (solid lines) profiles of % ID/g for untransduced T cells (Figure 4A) or anti-EGFR CAR-T cells (Figure 4B) in EGFR expressing U87 xenografts after intravenous (IV) administration of 20 million T cells per mice. Biodistribution was investigated in tumor, kidney, liver, lymph node and spleen (C) Observed (in dots) and model-generated (solid lines) profiles of % ID/g for anti-CD19 CAR-T cells (Figure 4C) in xenografts inoculated with Raji cells after IV administration of 1.5, 5.6, and 17 million CAR-T cells per mice. Biodistribution was investigated in tumor, liver and lungs
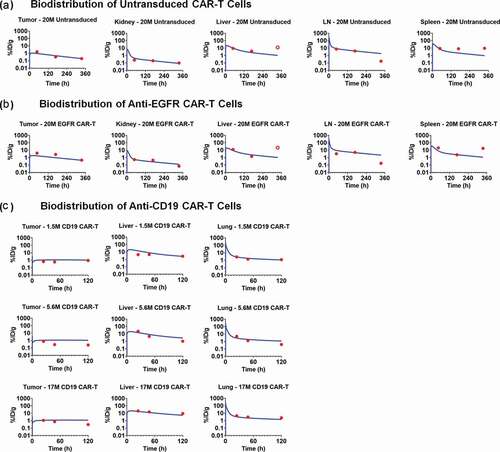
Figure 5. Observed and model fitted profiles for in vivo expansion of CAR-T cells and CAR-T induced tumor growth inhibition. (A) Anti-BCMA CAR-T cells: Figure A1 describes the observed (in dots) and model-generated (in lines) profiles of TGI induced in BCMA-expressing RPMI-8226 bearing xenograft mice after intravenous (IV) administration (day 0) of vehicle control (in blue) or 5 million anti-BCMA (bb2121) CAR-T cells/mice (plots in red). Figure A2 describes the observed (in dots) and model-generated (in lines) simultaneous profiles of CAR-T induced TGI (plots in red, Y1-axis) and apparent expansion of anti-BCMA CAR-T cells (profiles in green, Y2-axis) in blood. (B) Anti-HER2 CAR-T cells: The observed (in dots) and model-generated (in lines) profiles of TGI induced in xenografts inoculated with HER2-high SKOV3 (figures B1 and B3) and HER2-low PC3 (figures B2 and B4) tumors (day 0) among different flanks of same animal. Mice in the control group were treated with a single IV administration (day 23) of 10 million untransduced T cells (profiles in green), whereas mice in the treatment group were treated with single IV administration (day 23) of either (1) high-affinity 4D5 (Kd = 0.58 nM, profiles in red) or (2) low-affinity 4D5-5 (Kd = 1.1µM, profiles in blue) CAR-T cells at 3 million (figures B1 and B2) and 10 million (Figures B3 and B4) dose-levels
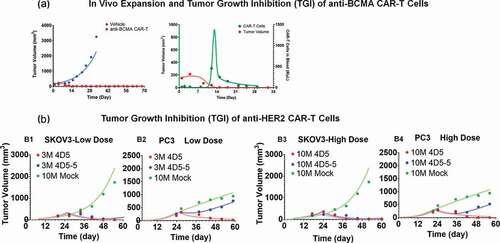
Figure 6. Observed and individual model fitted profiles for anti-CD19 CAR-T induced tumor growth inhibition. Xenograft mice inoculated with CD19-expressing HeLa cells (Day 0) were treated with intravenous (IV) administration of (1) PBS vehicle control (profiles in black), (2) 10 million untransduced T cells (profiles in blue), and (3) 10 million anti-CD19 CAR-T cells (profiles in red) on day 8 and 14. Xenograft mice inoculated with CD19-expressing NCI-H929 cells (Day 0) were treated with IV administration of (1) 1 million untransduced T cells (profiles in blue) and (2) 1 million CD19 CAR-T cells (profiles in red) on day 20
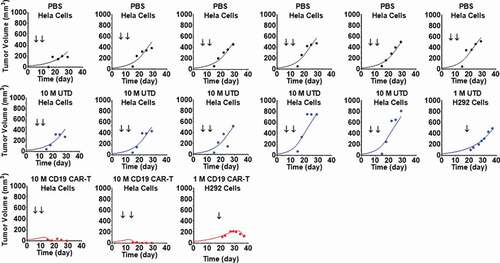
Figure 7. Observed and individual model fitted profiles for anti-EGFR CAR-T induced tumor growth inhibition. Intracranial xenograft mice, inoculated with EGFR-expressing U87 cells (Day 0), were treated with intratumoral (IT) administration of (1) PBS vehicle control (profiles in black), (2) 1 million high-affinity cetuximab CAR-T cells (profiles in red) and (3) 1 million low-affinity nimotuzumab CAR-T cells (profiles in blue) in a Q1WX3 dosing regimen, starting at day 4
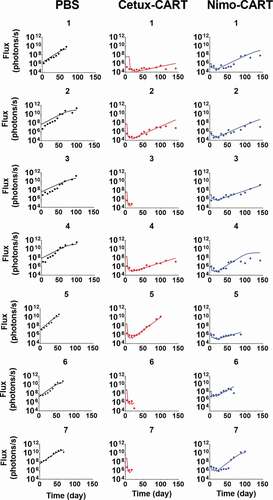
Figure 8. Model predictions using validated PBPK-PD model to simultaneously evaluate the effect of (1) CAR-T dose and (2) Initial tumor burden on (A and D) tumor growth inhibition (TGI), (B and E) generation of ‘number of CAR-Target complexes per tumor cell’ in the tumor extravascular space and (D and F) CAR-T cell expansion in blood: 1) CAR-T dose: Simulations were performed after single IV administration of anti-BCMA (bb2121) CAR-T cells in RPMI-8226 bearing xenografts, at dose-levels of 0.1, 1, 5, 10 and 50 million CAR-T cells per mouse. (2) Initial Tumor Burden: Simulations were performed after single IV administration of anti-BCMA (bb2121) CAR-T cells at dose-level of 5 million CAR-T cells per mouse in RPMI-8226 bearing xenografts with initial tumor burdens of 50, 100, 150, 250, 500 and 1000 mm3.
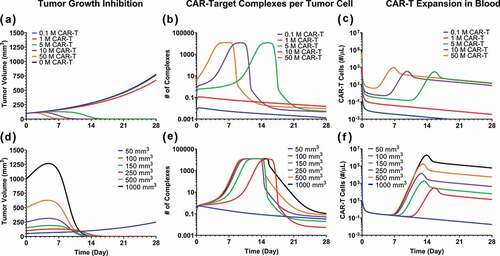
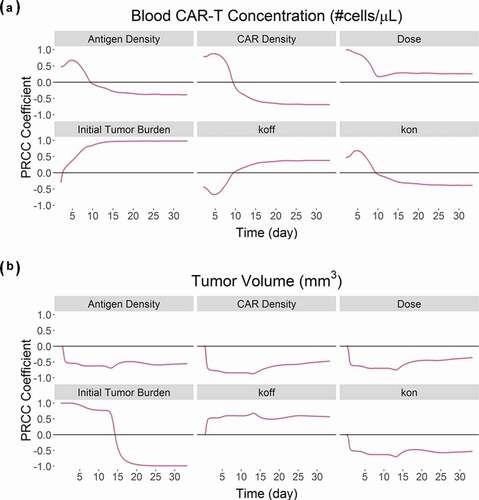
Figure 9. Results from the global sensitivity analysis on the developed PBPK-PD model for BB2121: PRCC-based sensitivity indexes of ‘Antigen Density’, ‘CAR Density’, ‘CAR-T dose’, ‘initial tumor burden’, ‘Koff’ and ‘Kon’ on (A) Blood CAR-T concentrations and (B) overall tumor volume