Figures & data
Figure 1. Schematic representation of the structures of monoclonal antibodies (a) and tandem scFv bsAbs (b). A specific example of a tandem scFv bsAb is blinatumomab, with two different scFv fragments that bind to the CD3 and B lymphocyte antigen CD19, respectively, and its biosimilar was used as a model tandem scFv bsAb molecule in this study
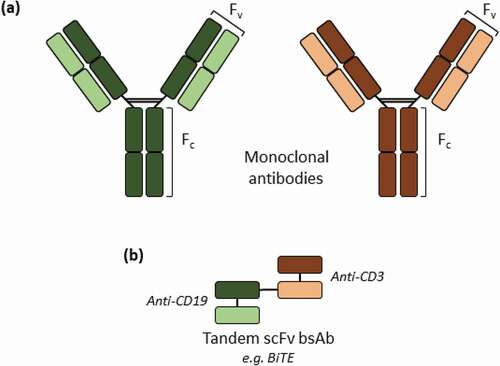
Figure 2. AKTA chromatogram of TOYOPEARLTM AF-rProtein L-650F with a step elution at pH 3.0, with the inset illustrating the HPLC-SEC chromatogram of the whole peak collected from TOYOPEARLTM AF-rProtein L-650F chromatography
Figure 3. (a) Representative Protein L chromatogram illustrating the separation of the monomer and HMW species peaks in the presence of NaCl, CaCl2, or Arg·HCl at pH 3.0. Shown here is the elution obtained in the presence and absence of 100 mM Arg·HCl, pH 3.0. (b) HPLC-SEC chromatograms of the first (top) and second peak (bottom) corresponding to predominantly monomers and HMW species, respectively. (c) Purity profile of peaks 1 and 2 illustrating the proportion of HMW species and monomer that eluted in the presence of 50 mM, 70 mM, 100 mM, and 500 mM of NaCl, CaCl2, and L-arginine, along with the corresponding monomer recovery. (d) Purity profile of peaks 1 and 2 of eluates obtained in the presence of 50–500 mM Arg·HCl, along with the corresponding monomer recovery
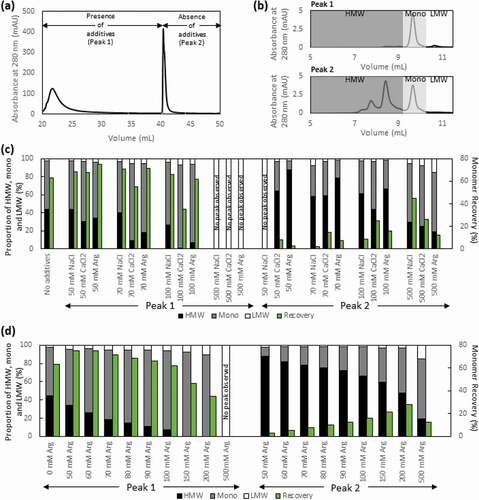
Figure 4. The elution peak obtained in the presence of varying concentrations of Arg·HCl (a), NaCl (b) and CaCl2 (c) demonstrates the differential increase in retention time and peak broadening compared to the elution peak obtained in the absence of salt additives (green). (d) The conductivity of eluate peak 1 is plotted as a function of monomer (%) for all three salt additives. (e) The hydrophobicity of the solvent environment at different Arg·HCl concentrations was probed with nile red fluorescent dye
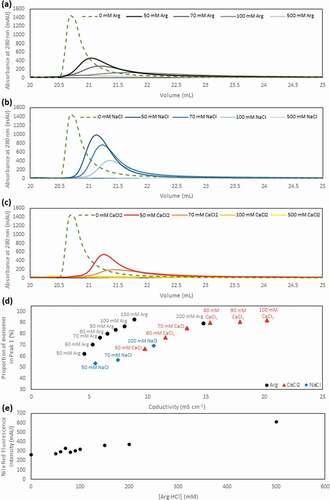
Figure 5. Schematic representation of the proposed mechanism involved in the different salt types
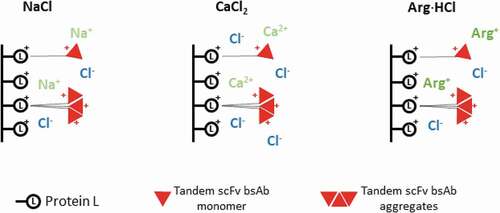
Table 1. Verification run for ToyopearlTM AF-rProtein L-650F, where 10 mg of tandem scFv bsAb monomer containing CCS was loaded per mL of resin, with 5 CVs each of DoE optimized wash buffer followed by 50 mM HEPES pH 7.4 buffer and finally eluting with 100 mM Arg·HCl acetate buffer at pH 3.0. Optimization of CaptoTM adhere conditions were performed in bind and elute mode
Figure 6. HPLC-SEC profile (a) and SDS-PAGE gel (b) illustrating purity of tandem scFv bsAb, which has an expected molar mass of 54.1 kDa, in the CCS, post-Protein L (PrL) and post-CaptoTM adhere (Capto)