Figures & data
Figure 1. mAb-1 demonstrated two main peaks (Peak-3 and Peak-4) in CEX analysis using pH gradient elution. The two main peaks exhibited different intrinsic fluorescence and re-equilibrated to a ratio similar to that ratio of unfractionated sample following reinjection of collected individual main peaks. The fluorescence profiles of reinjected peaks were also compared with initial unfractionated sample, which remained unchanged. (a) CEX chromatograms: initial injection of intact mAb-1 in black, reinjection of collected peak-3 in red, reinjection of collected peak-4 in blue. (b) PDA fluorescence profileof peak-3 and peak-4. (c) Fluorescence profile of peak-3 and peak-4 measured by 330 nm/350 nm
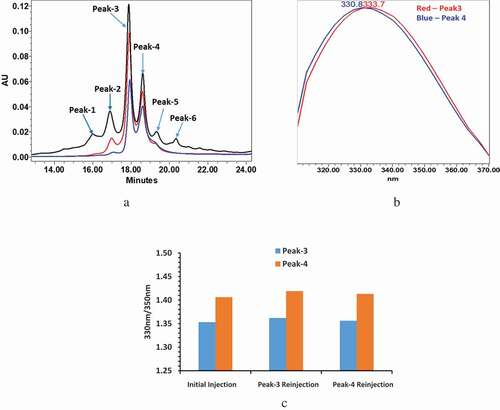
Figure 2. Intact mAb-1 was enzymatically digested using GingisKHAN in the upper hinge region to generate Fab and Fc domains. The digested domains were analyzed by CEX using pH gradient elution as described in the method section. The CEX profile of digested mAb-1contained three dominant peaks with distinct intrinsic fluorescence. (a) CEX chromatogram of digested domains of mAb-1. (b) Fluorescence profile of the three major peaks of the digested mAb-1: peak-A in red (330 nm/350 nm = 1.15), peak-B in blue (330 nm/350 nm = 1.38), peak-C in black (330 nm/350 nm = 1.58)
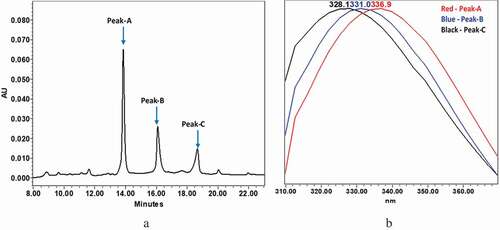
Figure 3. Enzymatically digested mAb-1 domains were separated by CEX and the three major peaks (Peak-A, Peak-B, and PeakC) were collected. The collected fractions were analyzed by RPLC-MS . Peak-A and Peak-B demonstrated the same retention time and same mass. (a) UV spectrum of the three major peaks. (b) Deconvoluted mass spectrum for the three major peaks
Figure 4. Molecular modeling. (a) Homology modele of mAb-1 with the HC-CDRs loop highlighted. (b) Loop modeling results showing the superposition of HC-CDR3 loop conformations. (c) Overlaid snopshots from the MD simulation
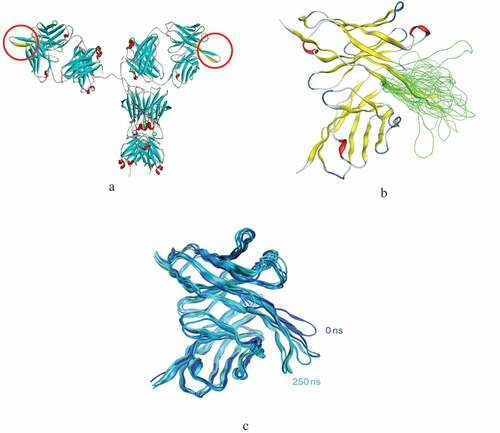
Figure 5. Comparison of molecular modeling results for the "open" and "closed" loop conformations. (a) Structures labeled with select pKa and solvent accessible surface area (SAA). (b) Hydrophobicity maps. (c) Charge analysis showing contiguous, charge surface patches
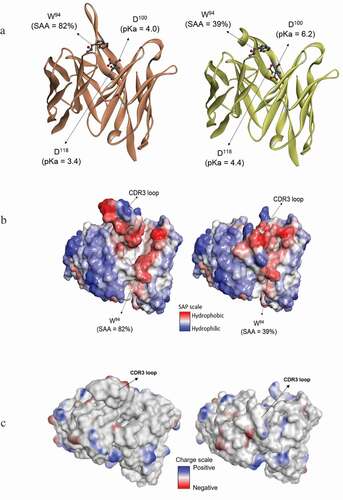
Figure 6. pH dependence of the interconversion of peak-3 and peak-4 were demonstrated using CEX by increasing the initial pH of the mobile phase. The desired initial pH of the mobile phase was achieved by altering the ratio of [NaH2PO4/Na2HPO4] and the pH value was measured offline by a pH meter. (a) CEX chromatographs of intact mAb-1 with different initial pHs of the mobile phase. (Color, initial pH mobile phase): Brown: pH ~6.4, Pink: pH ~6.2; Light blue: pH ~6.1; Green: pH ~5.9; Blue: pH ~5.4; Black: pH ~4.5. (b) Area % of peak-3 and peak-4: area of peak-3 increased when the initial pH of mobile phase increased (blue column); area of peak-4 decreased when the initial pH of mobile phase increased (orange column)
![Figure 6. pH dependence of the interconversion of peak-3 and peak-4 were demonstrated using CEX by increasing the initial pH of the mobile phase. The desired initial pH of the mobile phase was achieved by altering the ratio of [NaH2PO4/Na2HPO4] and the pH value was measured offline by a pH meter. (a) CEX chromatographs of intact mAb-1 with different initial pHs of the mobile phase. (Color, initial pH mobile phase): Brown: pH ~6.4, Pink: pH ~6.2; Light blue: pH ~6.1; Green: pH ~5.9; Blue: pH ~5.4; Black: pH ~4.5. (b) Area % of peak-3 and peak-4: area of peak-3 increased when the initial pH of mobile phase increased (blue column); area of peak-4 decreased when the initial pH of mobile phase increased (orange column)](/cms/asset/8947a28c-777c-4463-ab81-0fc3907cf7d0/kmab_a_1763138_f0006_oc.jpg)
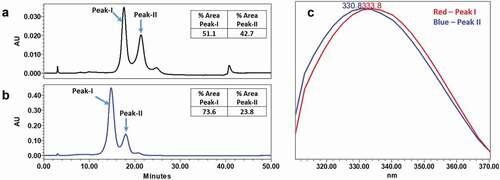
Figure 7. Analysis of mAb-1 using HIC. mAb-1 demonstrated two main peaks (peak I and peak II) in HIC analysis, and the two main peaks exhibited different intrinsic fluorescence. pH dependence of the interconversion of peak-I and peak-II were demonstrated using HIC by increasing the initial pH of the mobile phase. (a) HIC chromatographs of intact mAb-1 using acidic (pH 4.6) mobile phase. (b) HIC chromatographs of intact mAb-1 using near neutral mobile phase (pH 6.4). (c) Fluorescence profile of peak-I and peak-II