Figures & data
Figure 1. High throughput screening of ARG2 phage display round two outputs identified large numbers of human ARG2-specific binders, but few ARG2 inhibitors. Representative results illustrating that (a) clones sampled from ARG2 phage display selection outputs are highly specific for binding to ARG2 and not its paralogue, ARG1. (n = 1593/4400; ARG2 deltaF >100%, ARG1 deltaF <100%). In contrast, selection outputs contained (b) significantly fewer clones with an ability to inhibit recombinant human ARG2 (n = 1235). Lead candidate clones are highlighted: C0020185 (![]()
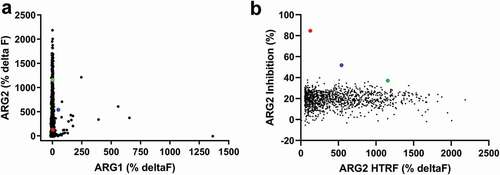
Figure 2. A lead panel of purified scFv specifically bind to and inhibit the enzymatic function of recombinant human trimeric ARG2. Representative data further characterizing clones C0020185 (Δ), C0020186 (▲) and C0020187 (□) originally identified in the parallel in vitro ARG2 biochemical and inhibition high throughput screens. Each clone binds (a) recombinant biotinylated trimeric human ARG2, but not (b) recombinant biotinylated trimeric human ARG1 and (c) effectively neutralizes recombinant trimeric human ARG2 in a scFv concentration-dependent manner. Direct binding was measured using HTRF®, titrating in purified scFv and using recombinant biotinylated human ARG2 or ARG1 trimer at a fixed concentration of 12 nM or 24 nM, respectively. A hook effect was observed at highest concentrations of scFv used.Citation23 ARG2 enzyme inhibition assay plotted as percentage. IC50 values ± standard deviation were determined for C0020185 (145.8 nM ± 9.1 nM), C0020186 (807.4 nM ± 312 nM) and C0020187 (446.8 nM ± 84.5 nM). The small molecule Arginase inhibitor NG-hydroxy-L-arginine (NHLA; ○) was used as a positive control (IC50 20640.0 nM ± 3933.8 nM). HTRF® and enzyme inhibition assay data points represent the mean of duplicate wells ± standard deviation across independent experiments (n = 2 and n = 4, respectively).
Figure 3. Lead ARG2 function-blocking clones appear to bind a common or overlapping epitope. Representative data showing that unlabeled C0020185 (Δ), C0020186 (▲) and C0020187 (□) scFv can compete away DyLight®650 labeled C0020187 scFv bound to human ARG2. Direct binding was measured using HTRF®. Labeled C0020187 scFv and biotinylated recombinant human ARG2 trimer were used at a fixed assay concentration of 100 nM and 12 nM, respectively. Assay data points represent the mean of duplicate wells ± standard deviation. Reciprocal competition experiments using DyLight®650-labeled C0020185 or C0020186 were also performed yielding similar results.
Figure 4. Amino acid sequence alignment of C0020187 and C0021158. Complementary-determining regions (CDRs) are delineated by black lines. Amino acid differences between the parent clone C0020187 and the affinity matured lead C0021158 are highlighted in white text on a red and blue background, respectively. All residues numbered according to Kabat.Citation26 All the CDR residue substitutions are non-conservative.
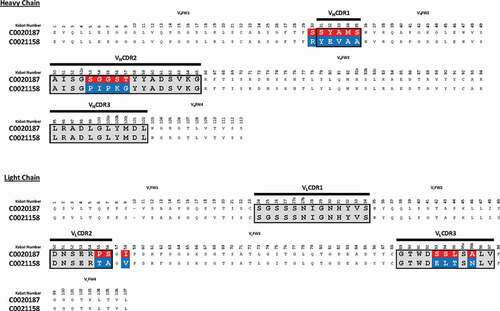
Figure 5. Recombinant human ARG2 is fully inhibited by C0021158 and C0021181 IgG1 in vitro. Representative results showing that C0021158 and C0021181 inhibit recombinant human ARG2 activity in vitro, with a IC50 (value ± standard error mean) of 18.5 ± 5.1 nM and 10.7 ± 2.3 nM, respectively. C0020187 (□), C0021158 (■), C0021181 (Δ) and irrelevant isotype control (♦). Human IgG1s were titrated into the assay, while maintaining a fixed concentration of recombinant ARG2. The arginase inhibitor NG-hydroxy-L-arginine (NHLA; ○) has an IC50 of 5046.0 ± 801 nM. Incomplete inhibition with C0020187 precludes assigning a definitive IC50 value for this IgG. Data points represent the mean of duplicate wells ± standard deviation across at least three independent experiments.
Figure 6. C0021158 IgG1 fully reverses ARG2-mediated inhibition of T-cell proliferation in vitro. Representative data showing that C0021158 (■) can relieve ARG2-mediated suppression of T-cell proliferation in vitro, with a mean EC50 value of 157 nM. C0020187 (□) IgG1 and the small molecule arginase inhibitor NG-hydroxy-L-arginine (NHLA; ○) partially restore the T-cell proliferation response. An irrelevant IgG1 (♦) did not relieve ARG2-mediated T-cell suppression. Cells incubated in the presence/absence of recombinant human trimeric ARG2 (15 µg/ml final concentration) plus a titration of antibodies or NHLA. BrdU incorporation was used as a direct measure of cell proliferation 78 hours after addition of ARG2 and antibodies or NHLA. The data pertaining to C0021158, C0020187 and irrelevant IgG1 represents the average percent proliferation of control (± standard deviation) from two independent experiments, with each experiment using a different donor. NHLA data represents the average percent proliferation of control (± standard deviation) of three independent experiments, using one, two and two different donors, respectively. T-cell proliferation data collected for NHLA was gathered using different donors to those used for C0021158, C0020187 and irrelevant IgGs. Two or more replicate data points were taken for each test concentration.
Figure 7. C0021158 inhibits recombinant ARG2 with a noncompetitive mechanism of action. The activity of trimeric ARG2 was measured at defined concentrations of C0021158 IgG1 while titrating different concentrations of L-arginine into the assay. Changing the concentration of C0021158 reduces the enzyme’s Vmax without significantly affecting its KM. Michaelis-Menten least squares fit model used to determine Vmax and KM values for a given concentration of C0021158 ().
Table 1. Vmax and KM values for the inhibition of recombinant human ARG2 trimer by C0021158 IgG1.
Figure 8. ARG2 trimer (blue) bound to C0021158 Fab (VH/CH in orange and VL/CL in light orange). (a) ‘Top down’ and (b) ‘side’ view. In the active sites, manganese atoms are shown as purple spheres and a sulfate ion as sticks. (c) Close-up of the boxed region in (b). Free ARG2 (PDB-ID 4HZE, light grayCitation28) was superimposed on C0021158 Fab-bound ARG2 (excluding the regions of conformational change, shown in dark purple). Key active site residues associated with antibody-induced inhibition of ARG2 are shown as sticks. The CDRs on the Fab are shown in yellow (VH) and light yellow (VL).
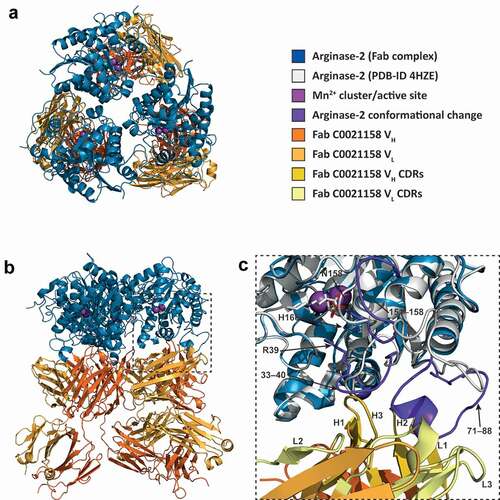
Figure 9. Structure of the human ARG2/C0021158 Fab binding interface and Fab-induced changes within ARG2’s active site. (a) Side view of the binding interface between C0021158 Fab and ARG2, with interacting side chains shown as sticks. Key active site residues involved in antibody-induced inhibition (Arg39, Asn158 and His160) are also shown as sticks for clarity. The Fab (VH/CH in orange and VL/CL in light orange, CDRs in yellow and light yellow for VH and VL, respectively) is shown as a cartoon inside a semi-opaque surface representation. ARG2 is shown as blue cartoon, with the region undergoing conformational change upon binding shown in dark purple, manganese ions shown as purple spheres and sulfate shown as sticks. (b) Close-up top-down view of the hydrophobic cleft between VH and VL and the central single-turn helix of the epitope on ARG2. (c) A close-up of the ARG2 active site when bound to C0021158 Fab (blue, with conformational changes upon binding in dark purple) superimposed with free ARG2 bound to an inhibitor (light gray, PDB-ID 4HZECitation28). Critical catalytic and coordinating side chains are shown as sticks. (d) Electron density map (2Fo – Fc, contoured at 2.0 σ (gray mesh) for regions of ARG2 within 2.0 Å of highlighted residues and ligands at the active site of ARG2 when bound to C0021158. Complexation of the dimanganese center and other interactions of interest are shown with black dashes.
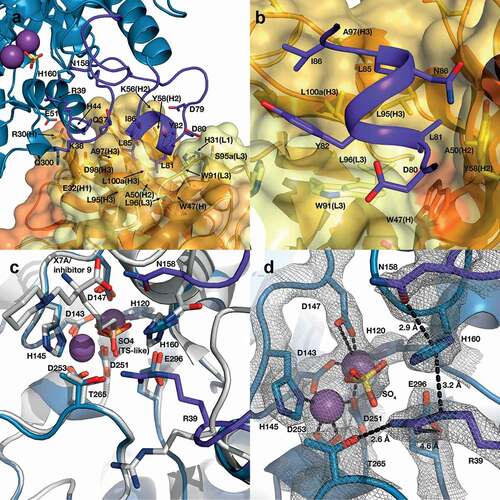
Figure 10. Isothermal titration calorimetry of the ARG2 small-molecule inhibitor S-(2-boronoethyl)-L-cysteine hydrochloride (BEC) with free ARG2 or ARG2-C0021158 Fab complex. Upper panel: Free ARG2. BEC (0.75 mM) was titrated to a solution containing 20 µM of human ARG2 (monomer concentration). Data was fitted to a one-to-one binding model using a 68.3% confidence interval as error. Lower panel: ARG2 bound with C0021158 Fab in a 1:1 mix. BEC at a concentration of 0.50 mM was titrated into a solution containing 20 µM of human ARG2 (monomer concentration) and 20 µM of C0021158 Fab.