Figures & data
Table 2. Parameter estimates of the mPBPK model.
Table 1. Study design showing treatment groups and dosing regimen.
Figure 1. Summary of representative experimental observations: (a) percent change (mean ± standard error of the mean, SEM) in body weight (BW) from baseline (day 21); (b) full colon histopathology summed score (mean ± SEM), day 30 on the left and day 49 on the right for each group (i.e., 9 and 28 days after the first dose). G1: Non-IBD mice (without CD45RBhigh T cell transfer), CNTO 5048 (10 mg/kg); G2: IBD mice (+ CD45RBhigh T cell transfer), isotype control (1 × 10 + 9 × 0.3 mg/kg); G3: IBD mice, CNTO 5048 (1 × 10 mg/kg); G4: IBD mice, CNTO 5048 (1 × 10 + 9 × 0.3 mg/kg); G5: IBD mice, CNTO 5048 (10 × 1.4 mg/kg); G6: IBD mice, CNTO 5048 (10 × 0.3 mg/kg).
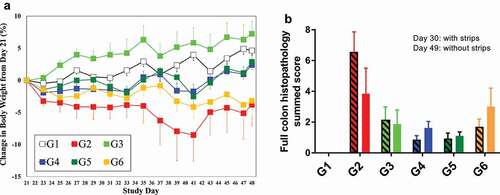
Figure 2. Observed percent (%) change (mean ± SD) from the mean TNF in the control group (G2) for serum (a) or colon free TNF in Groups 3–6 on Day 22, 30 and 49 (i.e., 1, 9, and 28 days after the first dose), and correlations between individual free TNF in serum (c) or colon (d) versus full colon histopathology summed score or neutrophil score on Day 30 and 49 (i.e., 9 and 28 days after the first dose). All BLQ TNF values were plotted at ½ of LLOQ.
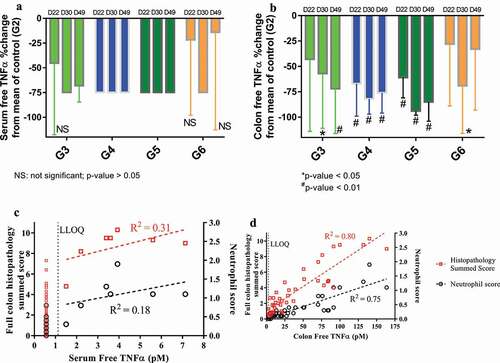
Figure 3. Scheme of mPBPK/TE model for the CNTO 5048 interaction with TNF in serum and colon. (a) Basic second-generation minimal PBPK was used to characterize serum CNTO 5048 pharmacokinetics; (b) Colon compartments were incorporated into the basic mPBPK model to characterize colon CNTO 5048 distribution; (c) TMDD in the serum compartment was integrated into Model B to characterize the free TNF profile in serum; and (d) TMDD in the colon compartment was added to Model C to characterize the free TNF dynamics in colon.
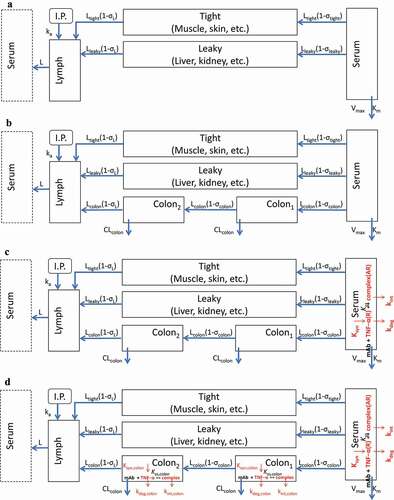
Figure 4. Model fitting for (a) CNTO 5048 in serum; (b) CNTO 5048 in colon homogenate Symbols represent the observed data (mean±SD); solid black lines and blue dashed lines represent model fitting results. The LLOQ of CNTO 5048 in serum and colon tissue were 0.533 and 2.67 nM, respectively. LLOQ for colon shown in black dotted lines, while serum mean concentrations are above LLOQ for all groups and therefore the LLOQ for serum is not shown.
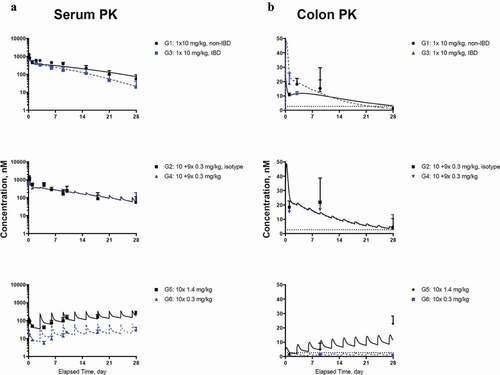
Figure 5. Model fitting for (a) free TNF in serum; (b) free TNF in colon homogenate. Symbols represent the observed data (mean±SD); lines represent model fitting results. The LLOQ of TNF in serum and colon tissue were 1.12 and 2.81 pM, respectively (shown in dotted lines).