Figures & data
Figure 1. Final configuration of human heavy (FHHC1.1-bcl2) and light (FHLC1.1) chain constructs used for the generation of transgenic rabbits expressing human IgG antibodies. Marked in red are human segments included in the constructs
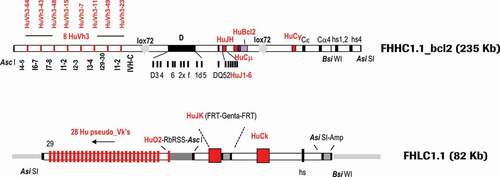
Table 1. Genotype specifications of immunized transgenic animals. Immunized rabbits (Ali/Bas background) were homozygous (+/+) for huIgK (FHLC1.1) and huCD79a/b (CD79ab) and hemizygous (±) for huIgG (FHHC1.1-bcl2) transgenes. Founders 1007658 and 1007340 differ on the chromosomal insertions of the FHHC1.1-bcl2 transgene. For the rbIgM KO (KOΔ: deletion mutation, KOI: insertion mutation), animals were either homo- or compound heterozygous. For details on KO nomenclature please refer to Flisikowska et al.Citation14
Table 2. Frequency of B-cell populations (%) of wild-type and transgenic rabbits
Figure 2. (a) Characterization of the peripheral B-cell compartment of wild-type and transgenic rabbits using FACS analyses. FACS dot plots per column show representative profiles of peripheral blood mononuclear cells (PBMCs) of one wild-type rabbit and three transgenic rabbits (500350, 500370, 500376). The FACS dot plots in each row represent five different FACS double staining of live PBMCs using the cell-surface markers indicated. (b) Frequencies of different B-cell populations. The B cell frequency is measured as percentage of the count of gated cell-surface marker X-positive B cells of all PBMCs
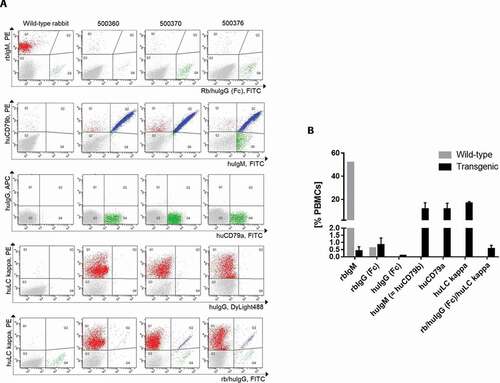
Table 3. Prior to immunization with BMP9, serum from the three selected transgenic rabbits was analyzed for the presence of rabbit and human IgG immunoglobulin chains at different ages
Figure 3. ELISA titer for antigen specificity. Serum from the three immunized transgenic rabbits was analyzed for the presence of rabbit and human IgG immunoglobulin chains during the course of immunization
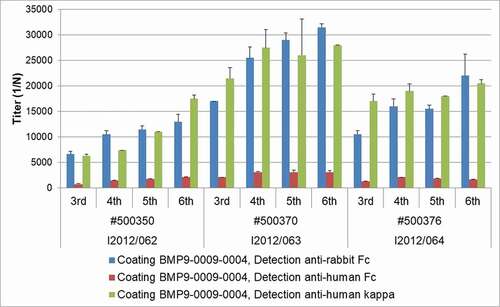
Figure 4. Yield of IgG-secreting and antigen-specific B-cell clones after primary screening. (a) Frequency of IgG-producing B-cell clones per total wells and (b) frequency of human BMP9-binding and IgG-secreting B-cell clones per total wells from wild-type and transgenic rabbits. Frequency of cynomolgus (c) or murine (d) BMP9-binding and IgG-producing B-cell clones per total wells from transgenic rabbits. For each parameter around 3500 wells were analyzed. The error bars represent the standard deviation. The lower cut off value of IgG-positive wells was > 0.013 µg/ml IgG and varied between OD 0.110 and OD 0.550 for BMP9-positive wells depending on the ELISA assay
Figure 5. (a) Correlation plot single dose BMP9-binding ELISA versus SMAD1 inhibition assay. Only antibodies with binding results > 0.5 (optical density) and inhibition >50% were selected for further evaluation. (b) Phospho-SMAD1-based IC50 analysis of a representative anti-BMP9 antibody shows inhibitory potency in the nM range
Figure 6. Correlation of the pSMAD1 inhibition with binding of BMP9 pro-domain using SPR measurements. Full and empty dot/quads indicate SPR binders and non-binders respectively, derived either from the second (dot) or the third (quad) immunization blood samples (Bleed 2 and 3). Bmp9.312, 335 and 353 are 3 non-inhibitory hits selected as reference
Table 4. Kinetic interaction parameters of human BMP9 pro-domain and anti-BMP9 Fab molecules. Association (ka) and dissociation (kd) rate constants, and the resulting dissociation equilibrium constants KD as determined by B4000 BIAevaluation Software using a 1:1 Langmuir fit. KD values represent avidity in addition to affinity binding due to possible bivalent binding of dimeric BMP9 to the two captured Fab molecules. Ratio Rmax is calculated for mature human BMP9 after release of pro-domain. Some of the obtained kinetic parameters are evaluated by the software but marked because they are outside of the limit of instrument (red labels)
Figure 7. Detailed kinetic analysis of obtained binding curves using surface plasmon resonance, where the anti-human BMP9 Fab molecules were captured to chip surface via anti-human Fab capture antibody and the binding of the human BMP9 pro-domain was analyzed. The obtained binding curves were evaluated using (a) the B4000 BiaEvaluation software, where the black lines corresponds to the measured binding responses and the red lines to the fitting curves using Langmuir 1:1 fit model with RI = 0 and (b) the InteractionMap® of Ridgeview Diagnostics Ab
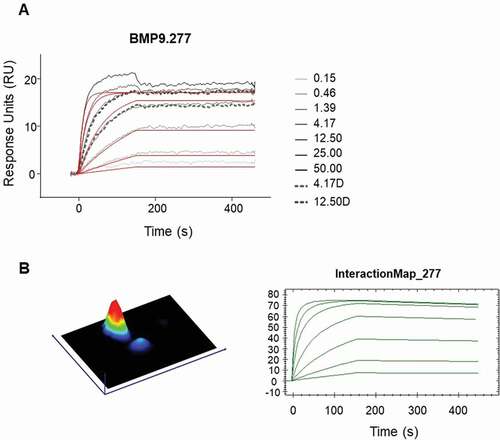
Figure 8. Epitope binning analysis using SPR. The upper Fab was precomplexed with a 20fold molar access of BMP9 pro-domain and then the binding to the captured Fab was analyzed. The values correspond to the ratio binding (%) calculated from the normalized binding of the Fab:BMP9 complex divided by the normalized binding response of the BMP9 pro-domain alone
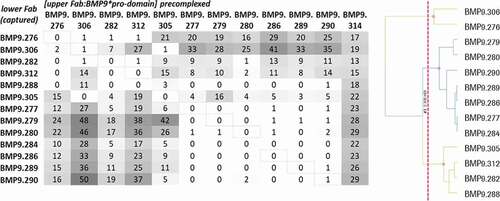
Figure 9. Kon/Koff plot – epitope bins of selected hits. Highlighted were the antibodies according to their respective epitope bins analyzed by SPR
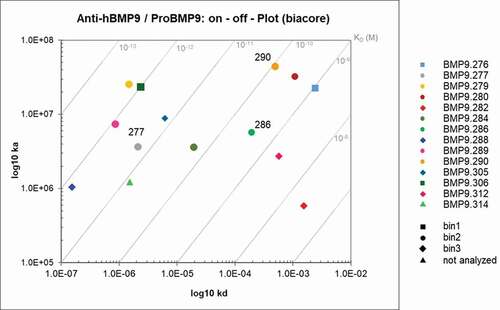
Figure 10. (a) Involvement of integrated V3 germlines in VDJ rearrangement. (b) Involvement of the 8 transgenic human germline VH sequences within the GC events. (c) Whole number of GC events in the BMP9 specific human heavy chain variable regions
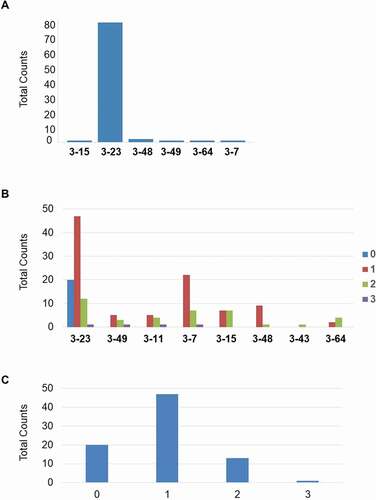
Figure 11. (a) Percentage of DNA mutation rate in CDRs and FRs of antibodies binding to BMP9; (b) Percentage of protein mutation rate in CDRs and FRs of about 1700 antigens specific antibodies from 10 different immunization campaign
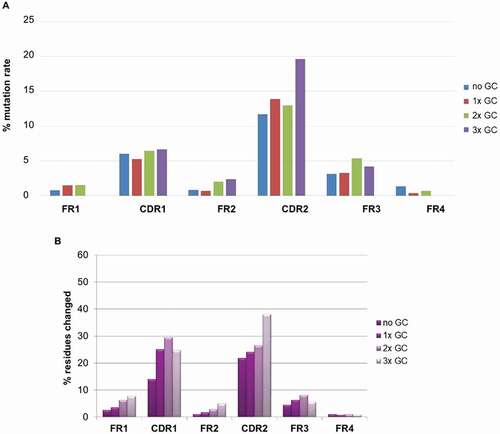
Figure 12. “Humanness” of fully human BMP9-specific binders compared to the best matching human VH (a) and VK (b) germlines. The 85% cut off corresponds to the percentage of homology defined by the American Medical Association (AMA) required for an antibody to be considered as “human”
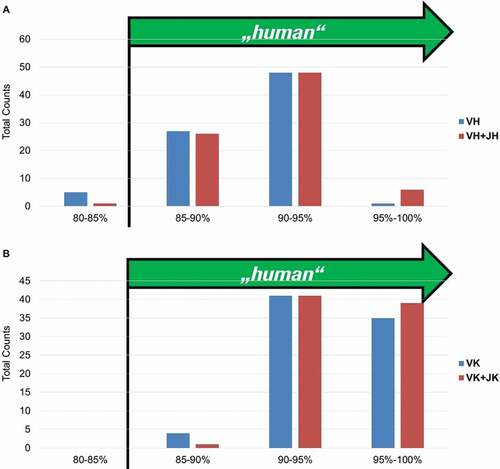
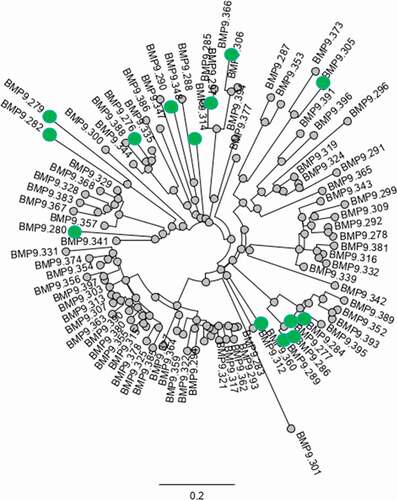
Figure 13. Analysis of sequence diversity of Ag-specific binders: phylogenetic tree of concatenated CDRs from VH and VK sequences. Highlighted (green dot) are the selected functional binders