Figures & data
Figure 1. Key structural features of hCAIX. (a) Schematic of hCAIX (red) in the cellular membrane.Citation79 (b) Localization of signal peptide (SP), proteoglycan (PG), catalytic, and transmembrane (TM) domains. (c) Structural representation of ΔPG-CAIXCys38Ser monomer (PDB 3IAI).Citation12 Hydrophilic residues in the catalytic cavity are shown in magenta, while hydrophobic are shown in cyan. Three arginine residues (R58, R60, R130), unique to CAIX within the CA family, that border the active site are highlighted in Orange. View is looking down into the catalytic cavity from above the membrane
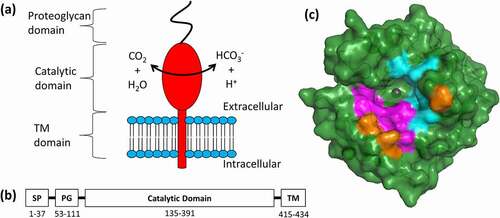
Table 1. Epitope assignment at the domain level by yeast surface display in native and denatured hCAIX fragments
Figure 2. Analysis of solution binding of c2C7, m4A2, m9B6 and cG250 to monomeric hCAIX by ITC. Binding isotherm curves are shown for the interaction of these antibodies to monomeric hCAIX. In all experiments the antibodies were titrated into a cell containing monomeric hCAIX. Concentrations of mAbs in the syringe were 37.5 µM and the concentration of the monomeric hCAIX in the cell was 10 µM
Table 2. Summary of critical parameters for HDX-MS experimentation.Citation80.
Figure 3. Differential HDX-MS of ADC-candidates c2C7 and cG250 bound to ΔPG- CAIXCys38Ser (PDB 3IAI). Regions demonstrating significant stabilization (3x SD, p = .01) across overlapping peptides at any single time point are color coded for clarity. Zinc is shown as a gray sphere. Regions with no significant change are shown in dark gray, while white corresponds to missing coverage. Kinetics plots corresponding to select peptides within structurally significant regions are shown with arrows indicating associated structural features. Unbound hCAIX control is shown in black, c2C7 in green, and cG250 in red and significant changes in deuteration are marked by asterisks. Data collected in triplicate
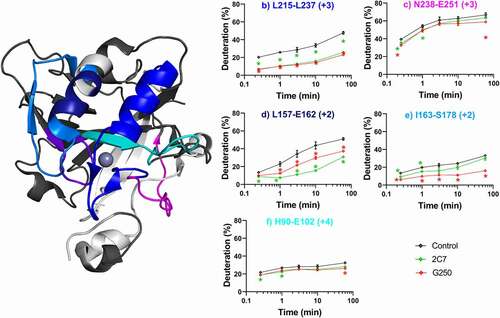
Figure 4. Differential HDX-MS of potential inhibitors m4A2 and m9B6 bound to ΔPG- CAIXCys38Ser (PDB 3IAI). Regions demonstrating significant stabilization (3x SD, p = .01) across overlapping peptides at any single time point are color coded for clarity. Regions with no significant change are shown in dark gray, while white corresponds to missing coverage. Key residues are shown as stick models (R58, R60, R130, H90, H92, H115), and zinc is shown as a gray sphere. Kinetics plots corresponding to select peptides within structurally significant region are shown with arrows indicating associated structural features. Unbound hCAIX control is shown in black, m4A2 in blue, and m9B6 in Orange, and significant changes in deuteration are marked by asterisks. Data collected in triplicate
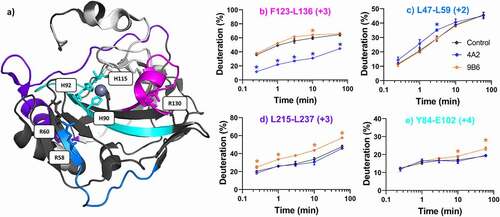
Figure 5. (a-b) Competitive SPR binding demonstrating that mAbs m4A2 and m9B6 bind to independent epitopes. (c) Analysis of CAIX catalytic activity by 67NR murine breast cancer cells expressing hCAIX incubated with anti-CAIX mAb m4A2 and/or m9B6, followed by addition of buffer and CO2-saturated water and monitoring the decrease in pH using the “in-cell” carbonic anhydrase activity assay. Cells incubated in the presence of IgG2b were used as a control. Data show the mean ± SEM of technical replicates (n = 3/group) and are representative of 2 independent experiments
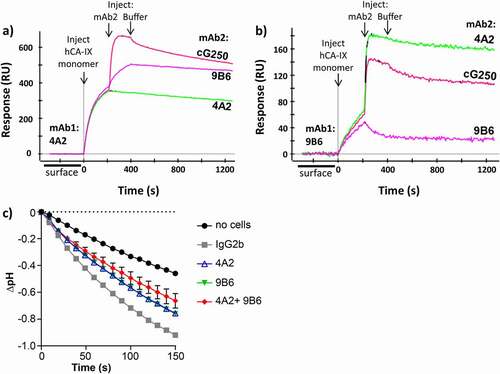
Figure 6. Differential HDX-MS of 4A2 and 9B6 combo bound to ΔPG-CAIXCys38Ser superimposed on PDB 3IAI. Regions demonstrating significant stabilization (3x SD, p = .02) across overlapping peptides at any single time point are shown in blue, while destabilization is shown in red. Regions with no significant change are shown in dark gray, while white corresponds to missing coverage
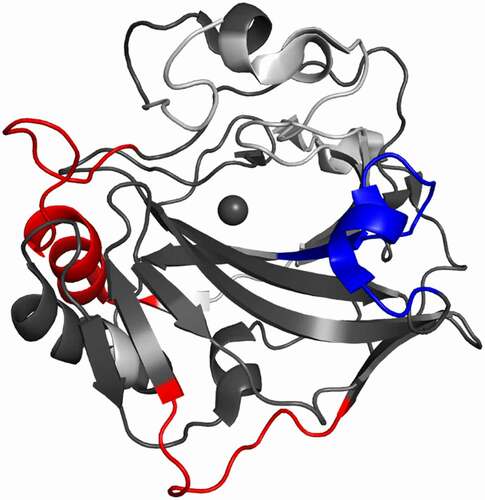
Figure 7. (a) Extracellular acidification profile of MDA-MB-231 human breast cancer cells constitutively expressing CAIX that were cultured with 10 μg/ml of 4A2 and subjected to a Glycolytic Rate Assay. Cells cultured with 10 μg/ml of 4A2 were used as a control. Rot/AA, rotenone with antimycin A; 2-DG, 2-deoxy-D-glucose. (b) Profile of proton efflux rate (PER) and glycolytic PER (glycoPER) of cells cultured as described in panel a. (c-e) Quantification of (c) basal proton efflux rate (PER), (d) basal glycolysis and (e) ratio of mitochondrial oxygen consumption rate to glycolytic proton efflux rate of cells cultured as described in panel a. (f-h) Quantification of (f) basal proton efflux rate (PER), (g) basal glycolysis and (h) ratio of mitochondrial oxygen consumption rate to glycolytic proton efflux rate of MDA-MB-231 human breast cancer cells constitutively expressing CAIX (CAIX +ve) or depleted of CAIX expression (CAIX – ve) and assessed using the Glycolytic Rate Assay. Data show the mean ± SEM of technical replicates (n = 5–6/group) ***P < .001
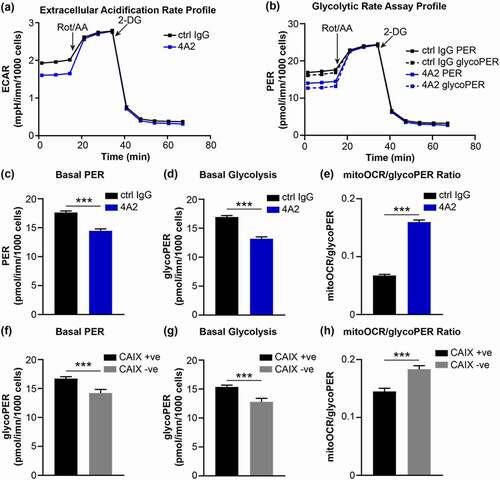
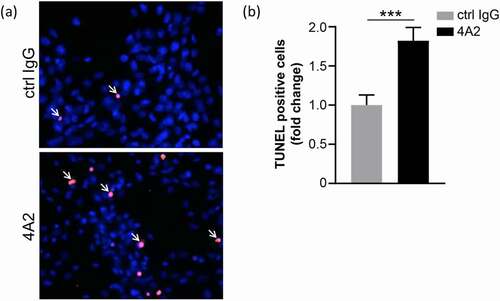
Figure 8. U87 MG glioblastoma cells treated with 100 μg/ml m4A2 or control mouse IgG antibody for 72 hours in hypoxia. After fixation a TUNEL assay was performed. (a) Representative images demonstrating the presence of TUNEL-positive U87MG cells (red, arrows). Nuclei are in blue. (b) Bar graph showing quantification of TUNEL-positive cells. Data show the mean fold change ± s.e.m. of technical replicates and are representative of 2 independent experiments N = 10 fields of view at 20x. ***P < .001