Figures & data
Figure 1. Representative results of hybridoma screening by competitive ELISA. The culture supernatants from hybridomas were mixed with HyIL-6 for analysis. The color formation is reported as an absorbance (OD450) observed for each hybridoma. The top 10 ranking antibodies were selected as antibody candidates based on their ability to neutralize the binding of HyIL-6 and sgp130-Fc. A bar graph showing the absorbance observed for each hybridoma.
Figure 2. The binding characteristics of antibodies to IL-6 and HyIL-6 from hybridoma culture supernatants. After the microplates were coated with IL-6 (20 ng/well) or HyIL-6 (60 ng/well) overnight, indirect ELISA was conducted with serial dilution of IgG-normalized hybridoma culture supernatants. The OD450 binding curves of hybridoma candidates C40, C14, C85, C92, C148, and C155 were shown in (a-f). Data are compiled from three independent experiments. Values represent the mean ± SEM. Fig. (a) to (f) Comparative line graphs plotting absorbance (OD450) observed of IL-6 versus HyIL-6 from C40, C14, C85, C92, C148 and C155 hybridoma candidates.
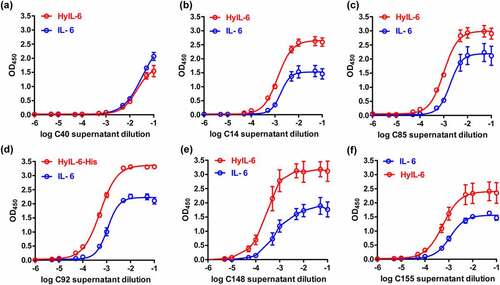
Figure 3. The activity of antibody candidates against IL-6 and HyIL-6 in vitro. HeLa cells (1 x 10⁵ cells/well) were stimulated with the mixture containing recombinant human IL-6 (20 ng/ml) or HyIL-6 (60 ng/ml) at the same molar ratio, with or without serial dilution of the hybridoma culture supernatants. STAT3 activation (p-STAT3) was determined 15 mins after IL-6/HyIL-6 stimulation by Western blot. Western blot analysis of antibody candidates against IL-6 and HyIL-6 in vitro, with or without serial dilution of various hybridoma culture supernatants.
Figure 4. The binding characteristics of purified C14mab. (a) The microplates were coated with human IL-6 (20 ng/well), HyIL-6 (60 ng/well), and IL-6 Rα (40 ng/well). Serial dilutions of C14mab were added for 1 hr at room temperature. The binding ELISA data is graphed with OD450 readings and their associated binding percentages vs. log antibody concentration. Data are compiled from three independent experiments. Values represent the mean ± SEM. (b) Data were normalized to maximum signal for IL-6 and HyIL-6 individually. EC50 values were obtained by nonlinear regression fitting to a variable slope, four-parameter dose-response model using the GraphPad Prism software (San Diego, CA, USA). (c) The binding of mouse HyIL-6 (60 ng/well) with C14mab was measured by ELISA as described in (a). Values represent the mean ± SEM from three independent experiments. Fig. (a) Comparative line graphs plotting absorbance (OD450) observed of IL-6 and HyIL-6 from log C14 mab concentrations. Fig. (b) Comparative line graphs plotting binding percentage of IL-6 and HyIL-6 from log C14 mab concentrations. Fig.(c) Comparative line graphs plotting absorbance (OD450) observed of HyIL-6 Human and HyIL-6 Mouse from log C14 mab concentrations.
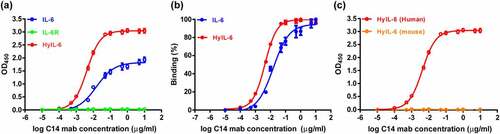
Table 1. Kinetic rate constants and equilibrium dissociation constants for the binding interaction of IL-6 and HyIL-6 with C14mab
Figure 5. Binding kinetics of C14mab. Biolayer interferometry analysis of the binding of C14mab to IL-6 (a) and HyIL-6 (b) was carried out. In brief, C14mab was loaded onto an Octet anti-mouse Fc-capture (AMC) sensor and incubated over a range of concentrations (1.56–25 nM) of IL-6 and HyIL-6, respectively. Kinetic parameters were evaluated by using a 1:1 binding model with global fitting. The experimental curves of each concentration (solid line) are shown alongside the fitted curves (dashed line). One representative set of curves is shown from three independent experiments. Comparative line graphs plotting binding of C14mab (incubated over a range of concentrations 1.56–25 nM) to IL-6 (Fig. a) and HyIL-6 (Fig. b) over time.
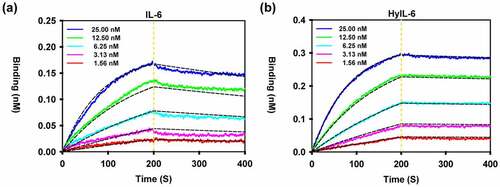
Figure 6. The inhibitory profile of C14mab in various IL-6-mediated signalings. (a) HeLa cells (1 x 10⁵ cells/well) were serum-starved for 5 hrs before stimulation. IL-6 (30 ng/ml) was premixed with indicated concentrations of C14mab or Tocilizumab for 15 mins. Cells were treated with the mixtures for 15 mins and p-STAT3 was determined by Western blot (left panel). The inhibition data is analyzed by ImageJ software and graphed with p-STAT3 activity percentages vs. log antibody (right panel). (b) C33A cells (1 x 10⁶ cells/well) were serum-starved for 5 hrs before stimulation. IL-6 (100 ng/ml) and sIL-6 Rα (200 ng/ml) were mixed for 15 mins, then the IL-6/sIL-6 R combination was incubated with indicated concentrations of C14mab, tocilizumab, or olokizumab for another 15 mins. Cells were treated with the mixtures for 15 mins and p-STAT3 was determined by Western blot. (c) For HyIL-6 mediated signaling blockade, HeLa cells (1 x 10⁵ cells/well) were stimulated with HyIL-6 (10 ng/ml) and indicated antibodies. The levels of p-STAT3 were determined by Western blot (left panel) and analyzed by Image J software (right panel) as described in (a). Fig (a) Left: Western blot analysis of IL-6 with various C14mab and Tocilizumab concentrations. Fig (a) Right: Line graphs plotting p-STAT3 activity percentages over log antibody (C14mab vs. Tocilizumab). Fig. (b) Western blot analysis of IL-6 and IL-6 R with various C14mab, Tocilizumab, and Olokizumab concentrations. Fig. (c) Left: Western blot analysis of HyIL-6 with various C14mab and Tocilizumab concentrations. Fig (c) Right: Line graphs plotting p-STAT3 activity percentages over log antibody (C14mab vs. Tocilizumab).
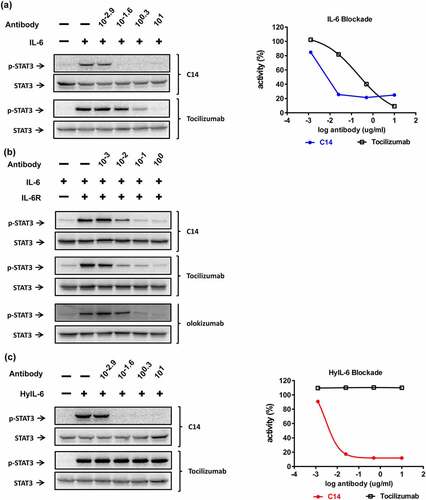
Figure 7. Neutralization activity of C14mab. (a) C14mab inhibits HyIL-6 induced VEGF expression in C33A. VEGF protein expression was evaluated by ELISA in the culture supernatant of C33A cells after incubation under treatment with HyIL-6 (50 ng/ml) in the presence or absence of the indicated concentrations of C14mab. The culture media were collected for the determination of VEGF levels. Data expressed as mean ± SD, n = 4. * Statistically significant difference from the positive control; P < .05. ** Statistically significant difference from the positive control; P < .01 (b) Wildtype naïve CD4+ T cells were stimulated with anti-CD3 and anti-CD28 for four days in the presence of TGF-β1 (2 ng/ml) and anti-IL-2 (10 ug/ml). HyIL-6 (50 ng/ml) mediated signaling was blocked in cultures using indicated concentrations of C14mab, tocilizumab, and olokizumab. IL-17A levels in culture supernatants were determined by ELISA (R&D Systems). Values represent the mean ± SD: n = 3. ** Statistically significant differences from the positive control; P < .01. (c) BALB/c mice were injected with either C14mab (0.1 mg/ml), DPBS, or isotype control antibody (0.1 mg/kg). After 1 hr, mice were challenged with recombinant human HyIL-6 (1 ug). After an additional 6 hrs, whole blood was collected. SAA levels were determined from serum by using the mouse SAA ELISA. (d) C14mab dose-dependently decreases HyIL-6 induced SAA levels in mice. BALB/c mice were injected with the indicated dose of C14mab. After 1 hr, mice were challenged with recombinant human HyIL-6 (1 ug). After an additional 6 hrs, whole blood was collected. SAA levels were determined from serum by using the mouse SAA ELISA. Data expressed as mean ± SD, n = 5. ** Statistically significant differences from the positive control; P < .01. Fig (a) Histogram of HyIL-6 induced VEGF expression with various indicated concentration of C14mab. Highest VEGF expression noted with 10(−3) concentration of C14mab. Fig (b) Three histograms of IL-17A levels with HyIL-6 mediated signaling blockage in indicated concentrations of C14mab, Tocilizumab, and Olokizumab. Fig. (c) Histogram of IL-6 induced SAA levels in mice with indicated injected concentrations of C14mab and isotype control antibody. Fig (d) Histogram of IL-6 induced SAA levels in mice with indicated injected concentration of C14mab.
Figure 8. The epitope of HyIL-6/C14mab interaction. (a) Differential HDX of HyIL-6 upon C14mab binding. A superimposed scatter plot shows pink, purple, green, Orange, blue, and red dots corresponding to data acquired at 30, 180, 600, 1800, and 5400 sec of deuteration. The sequence, 498LTKLQAQNQWLQD510, upon C14mab binding shows significant HDX reduction compared to other sequences. (b) A scheme depicts the assay procedure (left panel). The microplates were coated with sIL-6 Rα (50 ng/well) in PBS buffer at 4°C overnight and blocked with 1% BSA in PBS for 1 hr. Then plates were washed with PBS containing 0.05% Tween-20. Upper; without washing group, IL-6 (10 ng/well) was added for 1 hr at room temperature. Then serial dilution concentrations of C14mab were added directly for another 2 hrs. Lower; washing group, IL-6 (10 ng/well) was added for 1 hr at room temperature. After plates were washed with PBS containing 0.05% Tween-20, serial dilution concentrations of C14mab were added directly for another 1 hr. The bound C14mab was determined by ELISA. The binding results with or without washing before C14mab incubation are shown in blue and red, respectively (right panel). One representative assay of 3 is shown. Figure (8a) Scatter plot of relative uptake difference of HyIL-6 with C14 mab binding with various corresponding sec of deuteration (30,180, 600, 1800, and 5400 sec). Fig. (8b) Left: Assay procedures showing IL-6 added to IL-6 R coated plate with (lower diagram) and without PBS wash (upper diagram), then serial dilution concentration of C14mab were added to result in detected levels. Figure (8b) Right: Comparative line graphs plotting binding absorbance (OD450) with and without PBS wash with indicated log C14mab concentrations.
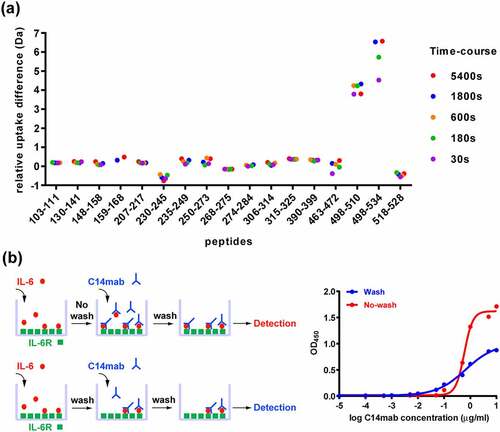
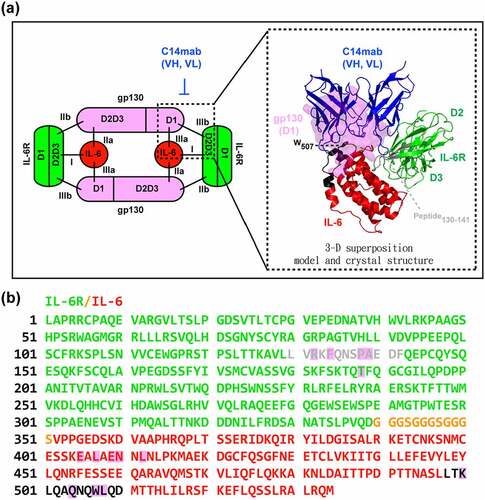
Figure 9. The proposed model of IL-6/IL-6 R/C14mab (a) The three key interaction sites of IL-6 (red), IL-6 R (green), and gp130 (pink) within the hexameric signaling complex are shown. The proposed model of IL-6/IL-6 R/C14mab and the trimeric structure of IL-6/IL-6 R/gp130 are superimposed. IL-6, IL-6 R, gp130, and C14mab are represented by a cartoon, shown in red, green, purple, and blue, respectively. The binding candidates, peptides 498–510 and peptides 130–141are demonstrated in black and gray, respectively. The surface representation of gp130 domain I overlap with C14mab interacting on IL-6 and IL-6 R in space. (b) HDX-MS was applied to map the epitope of the C14mab onto HyIL-6 by comparing the H/D exchange for HyIL-6 with that for the HyIL-6-C14mab complex. IL-6 R, linker, and IL-6 are colored green, Orange, and red, respectively. Candidate residues that are significantly reduced in the presence of C14mab are shown in black, while candidate residues with low reduction levels are shown in gray. The sequences with a pink background are the peptide sequences involved in the binding of IL-6 to gp130 (site III). (Fig. 9a) 2-D and 3-D models of IL-6/IL-6 R/C14mab with three key interaction sites of IL-6, IL-6 R, and gp130 with superimposed trimeric structure of IL-6/IL-6 R/gp130 and associated binding peptides, 498–510 and 130–141 (shown in black and gray). (Figure 9b) Epitope mapping of C14mab onto HyIL-6 with IL-6 R(green), linker(Orange) and IL-6(red). Candidate residue reduced with C14mab presence is shown in black while residue with low reduction level was shown in gray.