Figures & data
Figure 1. Discovery of a TREM2 agonist antibody that activates TREM2 without blocking TREM2–ligand interactions. (a) Illustration of the TREM2 agonist antibody screening strategy. (b) Flow cytometry showing candidate antibodies binding to cell surface TREM2 expressed on HEK293T cells. MFI: mean fluorescence intensity, n = 3 independent repeats. (c) Flow cytometry of TREM2-DAP12 NFAT-EGFP reporter cells showing the ligand competition profiles of the antibody candidates at 10 nM. n = 3 independent repeats. (d) Titration curves of antibody candidates in activating TREM2-DAP12 NFAT-EGFP reporter cells. The EC50 of Ab2 is labeled next to its titration curve. n = 3 independent repeats. (e) Titration curves of Ab2 for stimulating oAβ-lipid phagocytosis in hMGLs. MFI: mean fluorescence intensity. The EC50 of Ab2 is labeled next to its titration curve. n = 3 independent repeats. (f) Representative immunofluorescence images show that Ab2 stimulates oAβ-lipid phagocytosis in hMGLs. Scale bar = 10 μm. (g) Representative immunofluorescence images showing Ab2 binding to TREM2 expressed on HEK293T cell surface. Scale bar = 20 μm. (h) Representative immunofluorescence images showing Ab2 binding to hMGLs. Scale bar = 20 μm. For all the data presented, a bar graph with error bars represents the mean ± SD.
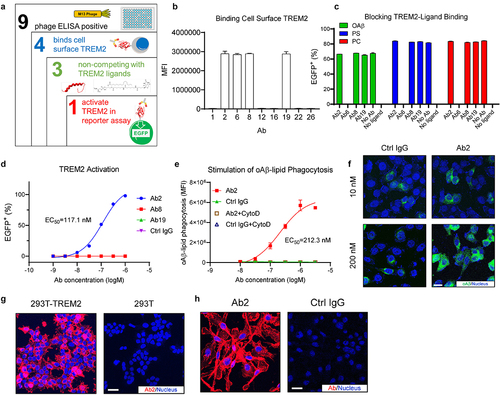
Figure 2. Engineering of TREM2 agonist Ab2 as TVD-Ig boosts the potency by more than 100-fold. (a) Illustration showing the 6 antibody formats used in the engineering study of Ab2. Although not depicted, all antibodies bear the LALAPG mutations in the Fc region which abolish the Fc-mediated effector functions of the antibodies. (b) Titration curves of various Ab2 formats in activating TREM2-DAP12 NFAT-EGFP reporter cells. The EC50 values of Ab2 TVD-Ig and IgG formats are labeled next to their respective titration curves. n = 3 independent repeats. (c). Immunoblotting shows the increased phosphorylation of SYK (as pSYK) of hMGLs treated with the Ab2 antibodies. (d) Titration curves of antibody-mediated SYK phosphorylation in hMGLs. Y-axis plots the fold change normalized to beta-actin and the untreated cell control. n = 3 independent repeats. (e) Titration curves of antibody-mediated stimulation of oAβ-lipid phagocytosis in hMGLs. MFI: mean fluorescence intensity. n = 3 independent repeats. (f) Representative immunofluorescence images showing Ab2 TVD-Ig (10 nM) stimulates oAβ-lipid phagocytosis in hMGLs, but Ab2 IgG shows no effect. Scale bar = 10 μm. (g) Representative immunofluorescence images show Ab2 TVD-Ig (10 nM) stimulates the migration of hMGLs toward oAβ-lipid, but Ab2 IgG shows no effect. Scale bar = 70 μm. (h) Titration curves of antibody-mediated stimulation of hMGLs migration toward oAβ-lipid. Y-axis presents the percentage of migration, which was calculated based on the migrated cell number divided by the total cell number. n = 3 independent repeats. (i) Titration curves of antibody-mediated stimulation of hMGLs survival under low CSF1 concentration (5 ng/mL). Y-axis presents percentage luminescence values produced by the ATP from live cells. n = 3 independent repeats. For all the data presented, a bar graph with error bars represents the mean ± SD.
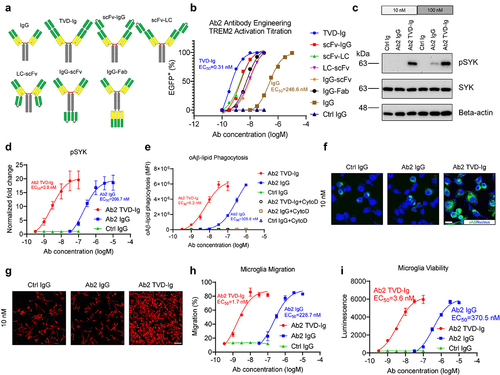
Figure 3. TREM2 activation by Ab2 TVD-Ig induces strong TREM2 clustering without changing TREM2 cellular distribution. (a) SEC profiles showing Ab2 TVD-Ig induces TREM2 clustering as indicated by the significantly larger complex sizes than that between Ab2 IgG and TREM2. (b) Representative immunofluorescence images showing Ab2 TVD-Ig (10 nM) stimulates TREM2 clustering in hMGLs, while Ab2 IgG only shows cell surface staining. Scale bar = 20 μm. (c) Flow cytometry showing TREM2 cell surface levels in antibody-treated hMGLs. MFI: mean fluorescence intensity. The figure legend labels the antibody treatment and the staining marker. n = 3 independent repeats. (d) Representative immunoblotting data showing sTREM2 levels in the supernatants of antibody-treated hMGLs. (e) Quantification of the immunoblotting data in D. Y-axis plots the fold change normalized to APP and the untreated cell control. n = 3 independent repeats. (f) Representative immunoblotting data showing total TREM2 levels in the antibody-treated hMGLs. (g) Quantification of the immunoblotting data in F. Y-axis plots the fold change normalized to calnexin and the untreated cell control. n = 3 independent repeats. For all the data presented, a bar graph with error bars represents the mean ± SD. For the statistical analysis, ns = not statistically different, two-tailed Student t-test.
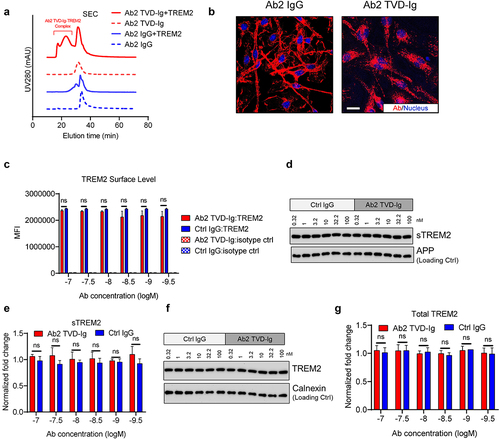
Figure 4. Ab2 TVD-Ig/αTfR bispecific antibody shows broad brain parenchyma distribution with more than 10-fold increased brain concentration. (a) Illustration showing the design of Ab2 TVD-Ig/αTfR and the corresponding control bispecific antibodies. (b) Sandwich BLI study showing the single-molecule incorporation of both Ab2 and αTfR in the Ab2 TVD-Ig/αTfR bispecific antibody. The corresponding proteins involved in each binding phase were labeled in the shaded area. “Wash” means dipping the sensor into a blank kinetics buffer to allow free dissociation. (c) Titration curves of TREM2-DAP12 NFAT-EGFP reporter cells treated by the antibodies. The EGFP+ percentage was measured by flow cytometry. n = 3 independent repeats. (d) Illustration of the ELISA design for the quantification of Ab2 TVD-Ig/αTfR or Ab2 TVD-Ig/Ctrl in the brain lysate or serum. (e) Antibody concentrations in perfused brains 24 hours after treatment (20 mg/kg through intraperitoneal injection). n = 5 independent mice. (f) Antibody concentrations in serum 24 hours after treatment as described in E. n = 5 independent mice. (g) Brain/serum antibody concentration ratios 24 hours after treatment as described in E&F. The ratios presented in Y-axis were calculated by brain antibody concentration (nM) divided by serum antibody concentration (μM) × 100. n = 5 independent mice. (h) Representative immunofluorescence images showing the antibody distribution in mouse brains 24 hours after treatment (20 mg/kg through intraperitoneal injection). To detect Ab2 distribution, streptavidin-Alexa Fluor 555 was used. The same brain slices were also co-stained with CD31 (blood vessel) and TO-PRO-3 (nucleus) to allow co-localization visualization. Scale bar = 20 μm. For all the data presented, a bar graph with error bars represents the mean ± SD. For the statistical analysis, ** P < .01, *** P < .001, two-tailed Student t-test.
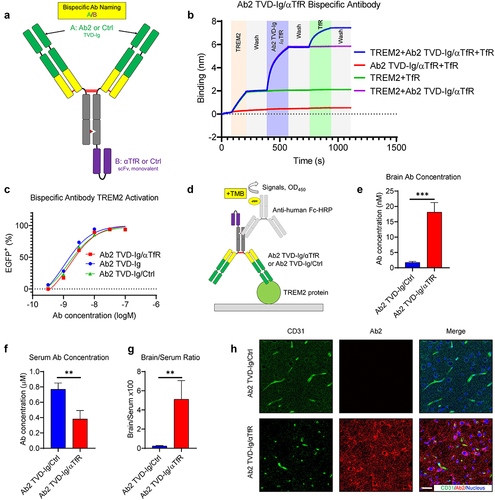
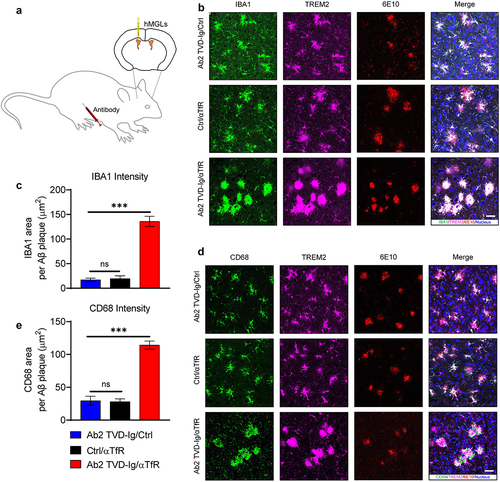
Figure 5. Ab2 TVD-Ig/αTfR significantly boosts microglia responses to amyloid plaques in 5XFAD mice. (a) Illustration showing the design of microglia grafting and animal treatment experiment. The microglia were grafted into lateral ventricles, and the antibodies were delivered through intraperitoneal (IP) injection. (b) Representative immunofluorescence staining images of amyloid plaque-microglia co-localization in the cortex of 5-mo-old 5XFAD mice treated by the designated antibodies (20 mg/kg intraperitoneal injection). Scale bar = 20 μm. (c) Quantification of IBA1 area within 30 μm of amyloid plaques in the cortex of mice treated as described in B. n = 5 independent mice. (d) Representative immunofluorescence staining images of amyloid plaque-CD68 co-localization in the cortex of 5XFAD mice treated as described in B. Scale bar = 20 μm. (e) Quantification of CD68 area within 30 μm of amyloid plaques in the cortex of mice treated as described in B. n = 5 independent mice. For all the data presented, a bar graph with error bars represents the mean ± SD. For the statistical analysis, ns = not statistically different, *** P < .001, two-tailed Student t-test.