Figures & data
Figure 1. Effects of metal catalyzed oxidation (MCO) by Cu(II)/Asc and Fe(II)/H2O2 on Fc (a) M255 and (b) M431 by LC-MS Tryptic Peptide Mapping.
Figure 2. Effects of MCO on (a) trastuzumab and (b) T-DM1 using Pearson correlation analysis. Pearson’s r-values outlined in yellow have P-value <0.05.
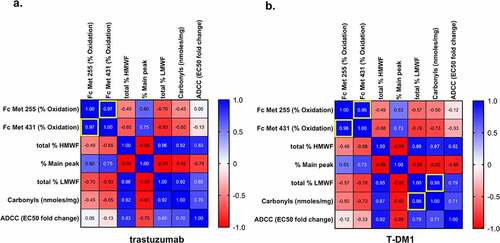
Table 1. Impact of MCO on Fc Met255 and Met431 oxidation, size variants changes, and carbonyl formation for mAbs and ADCs after various time points at 37°C. n = 3.
Figure 3. Effects of MCO on carbonylation (nmols carbonyls/mg protein) for (a) trastuzumab, (b) T-DM1, (c) NaPi2b, and (d) NaPi2b-vc-MMAE after various time points at 37°C. The cross (+) indicates results of the untreated control and values that are not significantly different from the untreated control. Error bars represent standard deviation where n = 3. *p < 0.05, **p < 0.01, ***p < 0.005, ****p < 0.001.
Figure 4. Impact of MCO on mAb and ADC peptide level (a, c) % oxidation and (b, d) % carbonylation as detected by LC-MS Tryptic Peptide Mapping. Treatment conditions = 0.01 mM Cu(II)/1 mM Asc 24 hr, 37°C and 0.05 Fe(II)/1 mM H2O2 up to 3hr, 37°C.
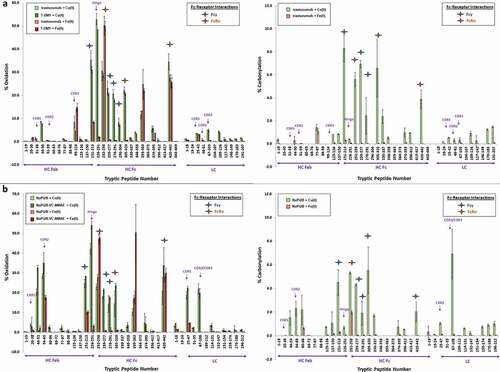
Table 2. Effects of MCO on trastuzumab binding to FcRn, FcγRIIIa, and HER2 antigen after metal catalyzed oxidation as measured by SPR.
Figure 5. Effects of MCO on Antibody-Dependent Cellular Cytotoxicity (ADCC) for (a) trastuzumab, (b) T-DM1, (c) NaPi2b, and (d) NaPi2b-vc-MMAE at 37°C after various timepoints. The cross (+) indicates results of the untreated control and values that are not significantly different from the untreated control. Error bars represent standard deviation where n = 3. *p < 0.05, **p < 0.01. Note that signal with anti-NaPi2b-vc-MMAE exceeded the upper limit of quantification and was therefore not included in panel d for statistical analyses.
Table 3. Effects of MCO on BT-474 cell proliferation for trastuzumab.
Figure 6. Impact of MCO on autophaghy for (a) trastuzumab, (b) T-DM1, (c) NaPi2b, and (d) NaPi2b-vc-MMAE.
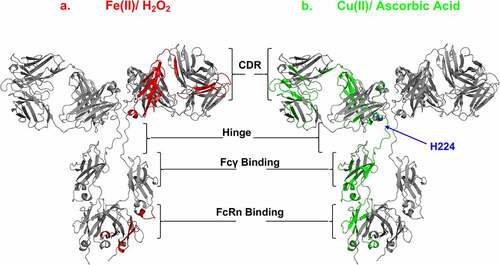
Figure 7. Effects of MCO on the mAb and ADC CDR, hinge, FcRIII and FcRn binding sites. IgG1 homology structure with mapped oxidation levels impacted by either (a) Fe(II)/H2O2 (red) or (b) Cu(II)/Asc (green) to the functional sites. Note: hinge residue “H224” is oxidized specifically by Cu(II), and not Fe(II). Cu(II) Model of IgG1 constructed using 1BJ1 and 1IGY crystal structures