
Figures & data
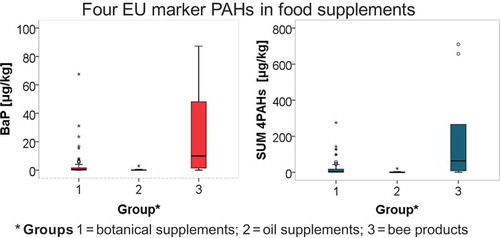
Table 1. List of the analysed food supplements samples with basic information.
Table 2. Relative standard uncertainties and relative expanded uncertainties for the whole method working range.
Figure 1. Example of quality control chart for benzo[a]pyrene measured in quality control sample (St. John’s Wort).
![Figure 1. Example of quality control chart for benzo[a]pyrene measured in quality control sample (St. John’s Wort).](/cms/asset/7b6ed7ae-ed56-49fc-a3e7-0610af1461fa/tfac_a_1087059_f0001_b.gif)
Table 3. Quantifier and qualifier ions of the four target PAHs with respective ratios and calculated relative permitted tolerance for the analyte identification.
Figure 2. Example of calibration for benzo[a]pyrene prepared from calibration standards and SRM® 2260a.
![Figure 2. Example of calibration for benzo[a]pyrene prepared from calibration standards and SRM® 2260a.](/cms/asset/de954ce2-45c6-4a78-8615-1e44918a7210/tfac_a_1087059_f0002_b.gif)
Figure 3. (colour online) Chromatographic separation of 4 target PAHs in food supplement of Ginkgo biloba with calculated chromatographic resolution (Rs) for critical pairs of PAHs (m/z 228 and m/z 252).
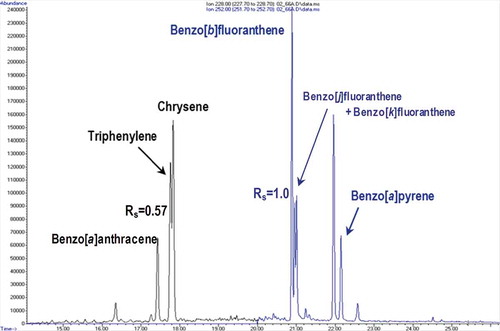
Table 4. Measured concentrations (μg/kg) of four EU marker PAHs in food supplements products and their sum (ƩPAH4) including the measurement uncertainties (μg/kg).
Table 5. Examples of daily intake levels of BaP and ΣPAH4 by the 10 most contaminated food supplements when assuming an intake of the maximum daily dose recommended by the manufacturers.