
Figures & data
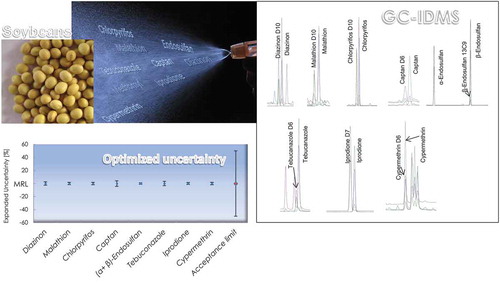
Table 1. GC-MS parameters for the determination of the selected pesticides.
Figure 1. Chromatogram obtained for a soybean sample spiked with pesticides corresponding to MRL levels.
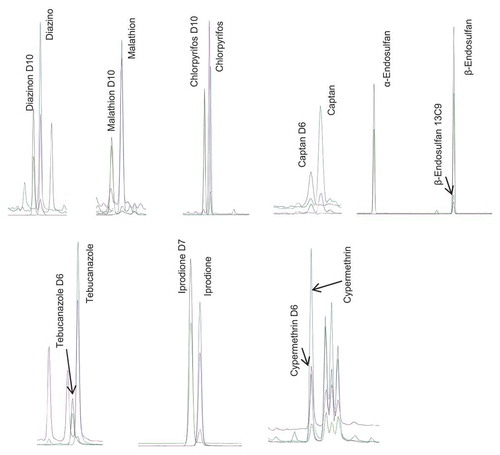
Table 2. Working range and external calibration equation a. Results are shown for 1 day and are representative for all validation days (n = 5).
Table 3. Precision of the method, precision of the trueness estimation and uncertainty budget.
Table 4. Mean recoveries (estimated as ratio of analytical concentration of target pesticides obtained by IDMS to the corresponding spiked concentration,%) and RSD (%, n = 5) obtained for the selected pesticides spiked at different levels in milled soyabeans.