
Figures & data
Figure 1. A schematic representation of the different sample clean up procedures tested during method development. LLE is liquid-liquid extraction using ethyl acetate
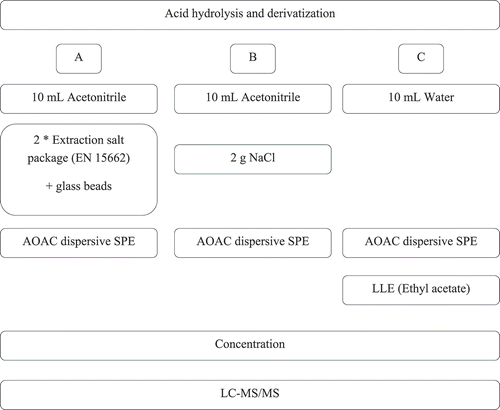
Table 1. MRM transitions of the PPAS and their internal standards, including the declustering potential (DP), collision energy (CE) and collision cell exit potential (CXP). The underlined product ion is the most abundant one
Figure 2. Absolute recoveries of procedure A (white), B (light grey) and C (black) for PPAS at 1 µg kg−1; chloramphenicol at 0.3 µg kg−1. The nitrofurans are not included because no derivatised marker metabolite standards were available
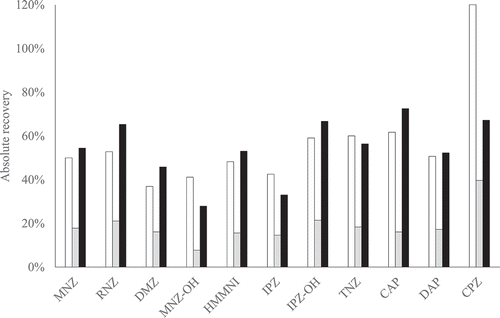
Figure 3. The average absolute recovery of sample preparation with the AOAC SPE kit (white) or this kit replaced by 400 mg PSA, 400 mg C18 and 1200 mg MgSO4 (light grey), by 400 mg C18 and 1200 mg MgSO4 (dark grey) or by 400 mg C18 (black), for all PPAS at validation level and half the validation level, except the nitrofurans. The error bars indicate ± standard deviation (n = 2)
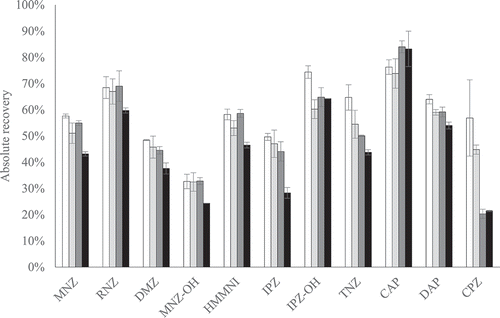
Figure 4. Absolute recoveries of sample preparation with a duplicated (white) or single (light grey) ethyl acetate extraction with 8 mL or a duplicated (dark grey) or single (black) ethyl acetate extraction with 6 mL for PPAS at 1 µg kg−1; CAP at 0.3 µg kg−1. The NFs are not included because no derivatised marker metabolite standards were available
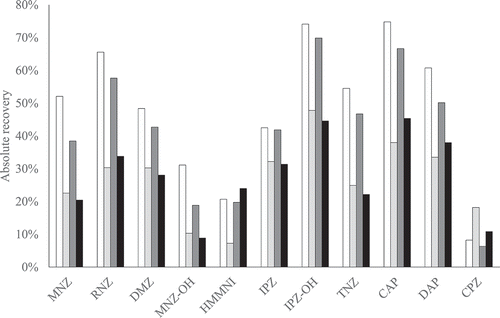
Table 2. The validation results in bovine milk; trueness, repeatability (RSDr), repeatability including matrix variance (RSDr*), within-laboratory reproducibility (RSDRL), decision limit (CCα), detection capability (CCβ) based on zero tolerance and CCαRPA and CCβRPA based on the RPA. n is the number of samples used for the calculations and is only presented if lower than 21. The underlined values exceed the established criteria
Table 3. The validation results in caprine milk; trueness, repeatability including matrix variance (RSDr*), within-laboratory reproducibility (RSDRL), decision limit (CCα), detection capability (CCβ). The underlined values exceed the established criteria