
Figures & data
Figure 1. Relation between relative standard deviations for repeatability (RSDr) and for reproducibility (RSDR) and the fraction of damaged grains in whole kernel cereals for three types: broken grains, sprouted grains and miscellaneous damage. Based on equations from CEN 15587:2018. The relationship between the Besatz fraction and RSDR calculated from the Horwitz equation is given for comparison.
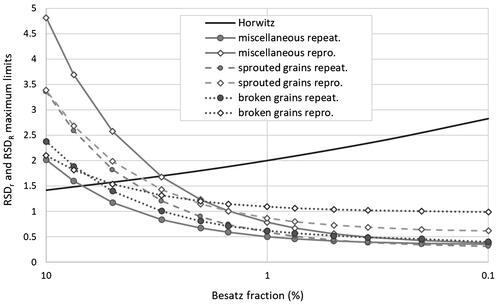
Figure 2. (a) Macroscopic analysis (result: count, weight), (b): microscopic analysis (result: Boolean presence/absence), (c) identification (result: identity), (d): composition (result: identities and share of the ingredients).
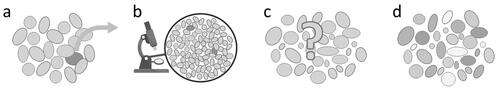
Table 1. Probability to find zero, one or more than one seeds in one out of four portions of a sample containing N seeds calculated from a binomial distribution.