
Figures & data
Figure 1. Exemplary chemical structures of different types of pyrrolizidine alkaloids and tropane alkaloids prevalent in milk samples.
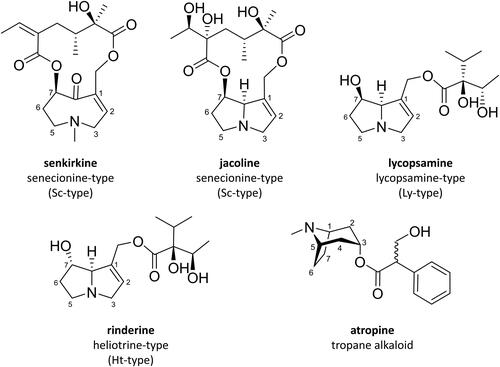
Table 1. Overview of milk samples collected from farms in Bavaria and Schleswig-Holstein throughout consecutive seasons named A–E.
Table 6. Exemplary scenarios (mean case and exemplary single case estimations) of consumer exposure to pyrrolizidine alkaloids (PA) and pyrrolizidine alkaloid N-oxides (PANO) via milk. The percentage of health-based guidance value (HBGV, 0.1 µg/kg b.w./d, BfR (Citation2016b)) (%), representing the risk of acute health impairment, and the margin of exposure (MOE, EFSA. (Citation2017)), representing an elevated risk for long-term adverse effects through PA/PANO, are shown for mean and high consumers. For calculation, 1 kg of milk was regarded as equal to 1 L.
Table 7. Exemplary single case estimations of consumer exposure to tropane alkaloids (TA) using two positive samples of milk (calculation of a mean case scenario not possible due to mean concentration < limit of detection). The percentage of the acute reference dose (ARfD, EFSA. (2013)) for the group of (−)-hyoscyamine and (−)-scopolamine, representing the risk of acute health impairment through TA intake, is shown for mean and high consumers. For calculation, the analytically determined atropine content was regarded as 100% (−)-hyoscyamine and 1 kg of milk was regarded as equal to 1 L.
Figure 2. Pyrrolizidine alkaloid (PA) and pyrrolizidine alkaloid N-oxide (PANO) sum content (µg/L) of PA/PANO-positive milk (n = 26) sampled between winter/spring 2020 and winter/spring 2022 in the regions Bavaria (sample numbers 1–108) and Schleswig-Holstein (sample numbers 109–228). Sorted by region and sum content. Dark grey: organic production, light grey: conventional production.
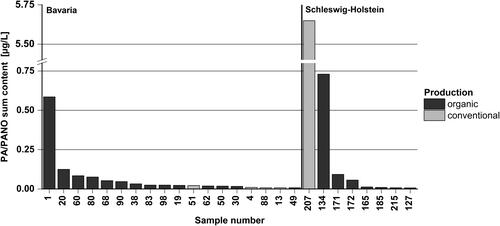
Table 2. Pyrrolizidine alkaloid (PA) and pyrrolizidine alkaloid N-oxide (PANO) content (µg/L) of PA/PANO-contaminated milk sampled in the region Bavaria. The samples originated from several farms with either organic or conventional production (for additional information see Supplementary Table S1). Non-listed samples had no detectable PA/PANO contents (<limit of detection). Only analytes detected in at least one sample from either Bavaria or Schleswig-Holstein are listed. PA/PANO contents were rounded to two significant figures where applicable.
Table 3. Pyrrolizidine alkaloid (PA) and pyrrolizidine alkaloid N-oxide (PANO) content (µg/L) of PA/PANO-contaminated milk sampled in the region Schleswig-Holstein. The samples originated from several farms with either organic or conventional production (for additional information see Supplementary Table S1). Non-listed samples had no detectable PA/PANO contents (<limit of detection). Only analytes detected in at least one sample from either Bavaria or Schleswig-Holstein are listed. PA/PANO contents were rounded to two significant figures where applicable.
Table 4. Exemplary estimations on pyrrolizidine alkaloid/pyrrolizidine alkaloid N-oxide (PA/PANO) intake of a dairy cow per day and corresponding amounts of plant material potentially present in the diet of a dairy cow when milk is highly contaminated with PA/PANO.
Table 5. Tropane alkaloid (TA) content (µg/L) of TA-contaminated milk sampled in the regions Bavaria and Schleswig-Holstein. The samples originated from several farms with either organic or conventional production. Data of the multi-analyte method and the independent verification analysis for tropane alkaloids are shown. Non-listed samples had no detectable TA contents (<limit of detection).