Figures & data
Figure 1. Solubility and turbidity of myosin in solution: (A) Solubility of myosin (5 mg/ml in 0.6 M NaCl PBS solutions) as related to pH with or without thermal treatment (75ºC water bath for 30 min). (B) Turbidity of myosin solution at λ=340 nm. Values are means ± SD (n >= 3), a-e indicates that the different letters are significantly different (P < 0.05).
Figura 1. Solubilidad y turbidez de la miosina en solución: (A) Solubilidad de la miosina (5mg/ml en soluciones de 0.6M NaCl PBS) en función del pH, con o sin tratamiento térmico (baño de agua a 75°C durante 30 min). (B). Turbidez de la solución de miosina a λ = 340 nm. Los valores son medias ± DE (n ≥ 3), a-e indican que las distintas letras son significativamente diferentes (P < 0.05).
Figure 2. Particle size distribution of myosin (0.5 mg/ml in 0.6 M NaCl PBS solutions) as related to pH before and after heated (75ºC water bath for 30 min).
Figura 2. Distribución de los tamaños de partículas de miosina (0.5mg/ml en soluciones de 0.6M NaCl PBS) en función del pH antes y después del calentamiento (baño de agua a 75ºC durante 30 min).
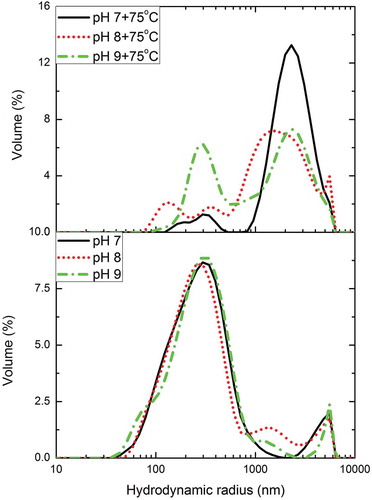
Figure 3. DSC endotherms of 10 mg/ml myosin in 0.6 M NaCl, 20 mM PBS, heated from 25 to 80ºC at 1ºC/min.
Figura 3. Endotérmicos DSC de 10mg/ml de miosina en soluciones de 0.6M NaCl, 20mM PBS, calentadas de 25 a 80°C, a 1°C/min.
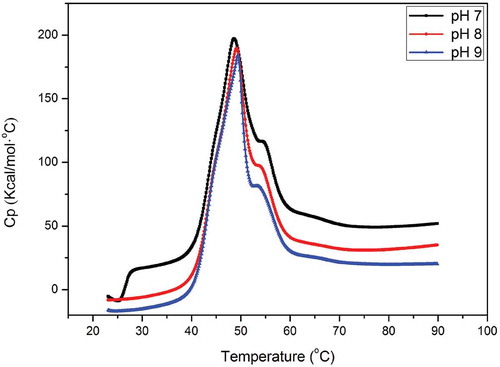
Figure 4. Changes in surface hydrophobicity (A) and reactive sulfhydryl content (B) of myosin (1 mg/ml in 0.6 M NaCl PBS solutions) with or without thermal treatment (75ºC water bath for 30 min) at different values of pH. Values are means ± SD (n >= 3), a-e indicates that the different letters are significantly different (P < 0.05).
Figura 4. Cambios en la hidrofobicidad superficial (A) y el contenido de sulfhidrilo reactivo (B) de miosina (1mg/ml en soluciones de 0.6M NaCl PBS) con o sin tratamiento térmico (baño de agua a 75ºC durante 30 min) con distintos valores de pH. Los valores son medias ± DE (n ≥ 3), a-e indican que las distintas letras son significativamente diferentes (P < 0.05).
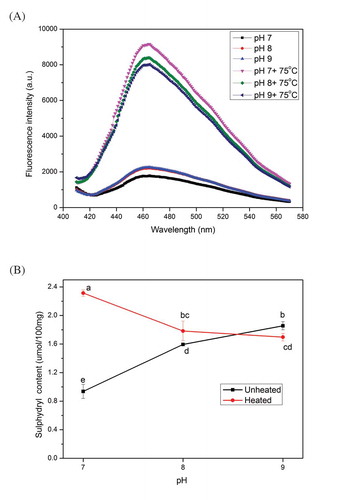
Figure 5. Far-UV circular dichroism (CD) spectroscopy of myosin with or without thermal treatment (75ºC water bath for 30 min) as a function of pH. The concentration of myosin solutions was 0.2 mg/ml.
Figura 5. Espectroscopía de dicroísmo circular (CD) de UV lejano de miosina con o sin tratamiento termal (baño de agua a 75ºC durante 30 min) en función del pH. La concentración de las soluciones de miosina fue de 0.2mg/ml.
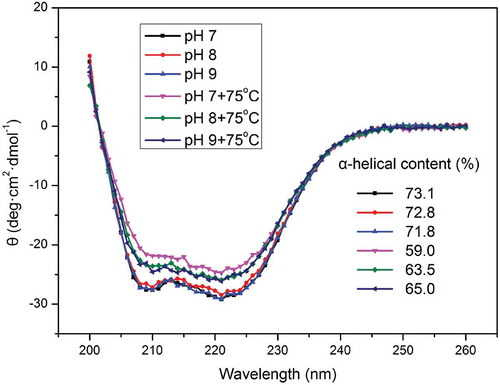
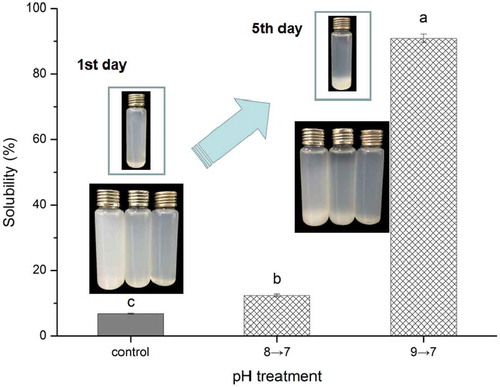
Figure 6. Solubility of myosin solutions with thermal treatment (75ºC water bath for 30 min) as related to pH-cycling. The photographs of the solutions at 1st day and 7th day were embedded in the figure. The bottle in the box is the untreated myosin solution, while the bottom three bottles are the solutions (from left, the control, 8→7 and 9→7) with thermal treatment after pH-cycling. Values are means ± SD (n >= 3), a-c indicates that the different letters are significantly different (P < 0.05).
Figura 6. Solubilidad de las soluciones de miosina con tratamiento térmico (baño de agua a 75°C durante 30 min) en función del ciclo de pH. Las fotografías de las soluciones tomadas en los días primero y séptimo fueron insertadas en la figura. La botella en la caja es la solución de miosina sin tratamiento, mientras que las tres botellas inferiores son las soluciones (desde la izquierda, el control, 8→7 y 9→7) con el tratamiento térmico posterior al ciclo de pH. Los valores son las medias ± DE (n ≥ 3), a-c indican que las distintas letras son significativamente diferentes (P < 0.05).