Figures & data
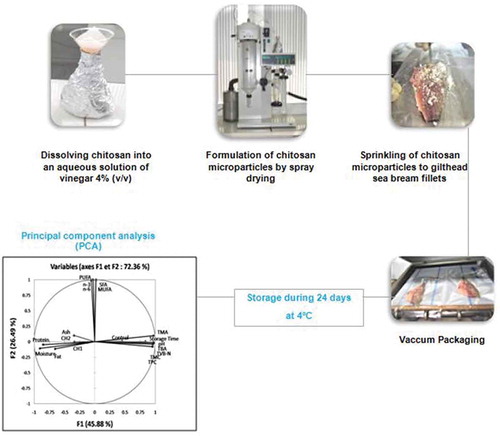
Figure 1. Bacterial growth evolution in total mesophilic TMC (a) and psychrotrophic TPC (b) counts of control (C) and chitosan-microparticles-coating (CMC) treated fillets (CH1 and CH2) during refrigerated storage. Values with different superscript letters (a-j) are significantly different (P < 0.05) according to ANOVA II and LSD post-hoc analysis. The dotted lines indicated the limit of acceptability.
Figura 1. Evolución del crecimiento bacteriano en recuentos de TMC mesofílica total (a) y TPC psicrotrófica (b) del control (C) y los filetes tratados con el revestimiento de micropartículas de quitosano (CMC) (CH1 y CH2) durante el almacenamiento refrigerado. Los valores con diferentes letras superíndice (a-j) son significativamente diferentes (P < 0.05) según ANOVA II y el análisis LSD post hoc. Las líneas punteadas indican el límite de aceptabilidad
Table 1. Changes in proximate composition of control (C) and coated fillets (CH1 and CH2) during the storage*.
Tabla 1. Cambios en la composición proximal del control (C) y los filetes recubiertos (CH1 y CH2) durante el almacenamiento*
Figure 2. Changes in quality indicators: pH (a), TVB-N (b), TMA (c) and TBA (d) of control (C) and coated fillets (CH1 and CH2) with chitosan microparticles during refrigerated storage. Values with different superscript letters (a-k) are significantly different (P < 0.05) according to ANOVA II and LSD post-hoc analysis. For TMA was analyzed by Kruskal-Wallis test. The dotted lines indicated the limit of acceptability.
Figura 2. Cambios en los indicadores de calidad: pH (a), TVB-N (b), TMA (c) y TBA (d) del control (C) y los filetes recubiertos (CH1 y CH2) con micropartículas de quitosano durante el almacenamiento refrigerado. Los valores con diferentes letras superíndice (a-k) son significativamente diferentes (P < 0.05) según ANOVA II y el análisis LSD post hoc. Para El TMA se analizó mediante la prueba de Kruskal–Wallis. Las líneas punteadas indican el límite de aceptabilidad
Table 2. Changes in fatty acid composition of control (C) and coated fillets (CH1 and CH2) during the storage (%)*.
Tabla 2. Cambios en la composición de ácidos grasos del control (C) y los filetes recubiertos (CH1 y CH2) durante el almacenamiento (%)*
Figure 3. The Principal Component Analysis (PCA) carried out on all variables (Storage time, pH, TMA, TVB-N, TBA), Bacterial counts (TMC and TPC), fatty acids and batches: Control, CH1 and CH2.
Figura 3. El análisis de componentes principales (PCA) se realizó en todas las variables (tiempo de almacenamiento, pH, TMA, TVB-N, TBA, recuentos bacterianos (TMC y TPC), ácidos grasos y lotes: control, CH1 y CH2