
Figures & data
Table 1. Indicators of antioxidant activity and half-maximal inhibitory concentration (IC50) of antihemolysis activity of fractions obtained from wild shrimp (Litopenaeus stylirostris) muscle.
Tabla 1. Indicadores de actividad antioxidante y concentración inhibitoria 50% (IC50) de la actividad antihemólisis de las fracciones obtenidas del músculo del camarón salvaje (Litopenaeus stylirostris)
Figure 1. Cell viability of ARPE-19 cells exposed to a) different concentrations of H2O2 (0.06 to 20 mM) for 30 min, and b) to different concentrations of fraction M (fM) (12.5 to 400 μg/mL) for 24 h. Values represent means from three determinations. Control cell cultures were incubated with DMSO as the vehicle solvent at a maximum concentration of 0.5% and represent 100% viability.
Figura 1. Viabilidad celular de las células ARPE-19 expuestas a: a) diferentes concentraciones de H2O2 (0.06 a 20 mM) durante 30 min y b) diferentes concentraciones de fracción M (fM) (12.5 a 400 μg/mL) durante 24 horas. Los valores representan las medias de tres determinaciones. Los cultivos celulares de control se incubaron con DMSO como disolvente vehículo a una concentración máxima de 0.5% y representan una viabilidad de 100%
Figure 2. Cell viability of H2O2-induced damage ARPE-19 cells, previously exposed to 100 μg/mL of different fractions from wild shrimp (Litopenaeus stylirostris) muscle after 4 and 24 h. Values represent means from three determinations. Different letters among bars mean significant differences (P ≤ 0.05); Tukey´s least significant difference test. Fractions were obtained from open column chromatography.
Figura 2. Viabilidad celular de células ARPE-19 con daño inducido por H2O2, previamente expuestas a 100 μg/ml de diferentes fracciones del músculo del camarón salvaje (Litopenaeus stylirostris) después de 4 y 24 horas. Los valores representan las medias de tres determinaciones. Las distintas letras entre barras significan que existen diferencias significativas (P ≤ 0.05); prueba de Diferencia Mínima Significativa de Tukey. Las fracciones se obtuvieron mediante cromatografía en columna abierta
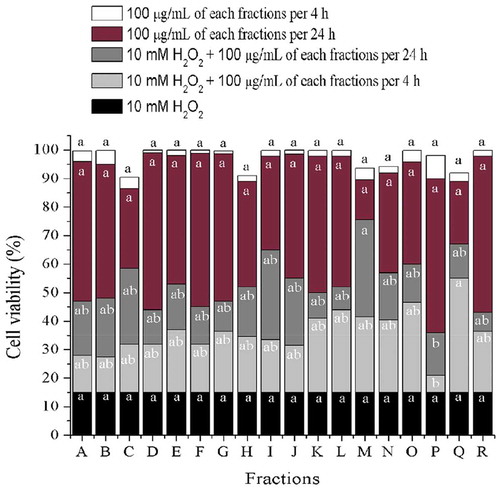
Figure 3. Effect of H2O2 on structural cellular aspects of ARPE-19 human cell line, and the retinoprotective effect of fraction M (fM) against H2O2-induced cell injury. Cells actin-microfilament cytoskeleton (red-colored) and nuclear DNA (blue-colored), after staining with phalloidin and DAPI, respectively. Observations were made at 20x. Control cells were incubated with DMSO as the vehicle solvent at a maximum concentration of 0.5% and represent no morphologic changes.
Figura 3. Efecto de H2O2 sobre los aspectos celulares estructurales de la línea celular humana ARPE-19 y efecto retinoprotector de la fracción M (fM) contra la lesión celular inducida por H2O2. Citoesqueleto de actina y microfilamento de células (de color rojo), y ADN nuclear (de color azul), después de su tinción con faloidina y DAPI, respectivamente. Las observaciones se hicieron a 20x. Las células control se incubaron con DMSO como disolvente vehículo a una concentración máxima de 0.5% y no representan cambios morfológicos
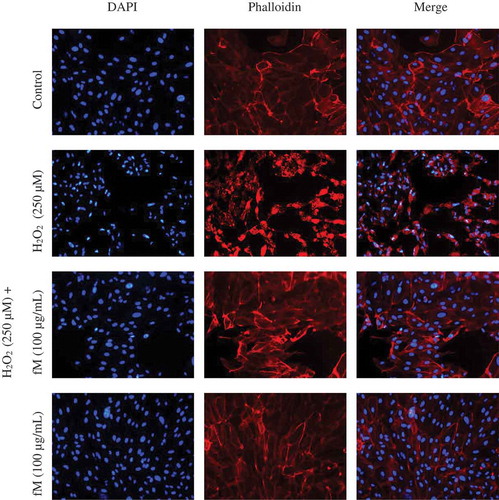
Figure 4. Retinoprotective effect of fraction M (fM) against H2O2-induced intracellular ROS production in ARPE-19 cells. a) Intracellular ROS production in cells exposed to different concentrations of H2O2. b) Intracellular ROS production in cells treated with different concentrations of fM during 24 h. c) Intracellular ROS production in cells treated with and without 250 μM H2O2 and fM at different concentrations per 24 h, (-) stimulus not used, (+) stimulus used. d) Microscopic visualization of the effect of fM on H2O2-induced intracellular ROS production. Images were selected as representative data from three independent experiments (at 20x). Control: not stimulated cells. Each value represents the mean ± SD of three independent experiments (P ≤ 0.05); Tukey´s least significant difference test.
Figura 4. Efecto retinoprotector de la fracción M (fM) contra la producción de ROS intracelular inducida por H2O2 en células ARPE-19. a) Producción intracelular de ROS en células expuestas a diferentes concentraciones de H2O2. b) Producción intracelular de ROS en células tratadas con diferente concentración de fM durante 24 horas. c) Producción intracelular de ROS en células tratadas con y sin H2O2 250 μM y fM a diferentes concentraciones por 24 horas; (-) estímulo no utilizado, (+) estímulo utilizado. d) Visualización microscópica del efecto de fM sobre la producción de ROS intracelular inducida por H2O2. Las imágenes se seleccionaron como datos representativos de tres experimentos independientes (a 20x). Control: células no estimuladas. Cada valor representa la media ± DE obtenida en tres experimentos independientes (P ≤ 0.05); prueba de diferencia menos significativa de Tukey
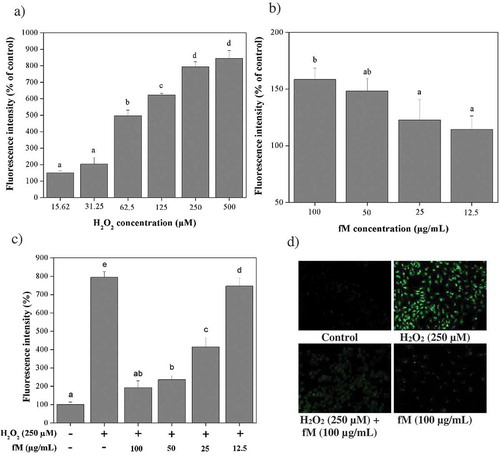
Table 2. 13C- and 1H-NMR analyses of fraction M dissolved in CDCl3.
Tabla 2. Análisis de 13C y 1H-RMN de la fracción M disuelta en CDCl3.