Figures & data
Figure 1. Flow diagram carried out for the extraction process of biosurfactant extract with ethyl acetate (a) and images of the different fractions generated during the separation of phases (b).
Figura 1. Diagrama de flujo para llevar a cabo el proceso para la extracción del extracto de biosurfactante con acetato de etilo (a) e imágenes de las distintas fracciones generadas durante la separación de fases (b)
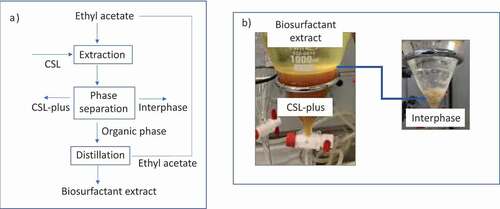
Table 1. Composition of the raw CSL and CSL-plus used in this study*.
Tabla 1. Composición del CSL inicial y CSL-plus usado en este estudio*
Figure 2. Mass spectrum of fatty acids for CSL (a), CSL-plus (b), and biosurfactant extract (c).
Figura 2. Espectro de masas de los ácidos grasos de CSL (a), CSL-plus (b), y extracto de biosurfactante (c)
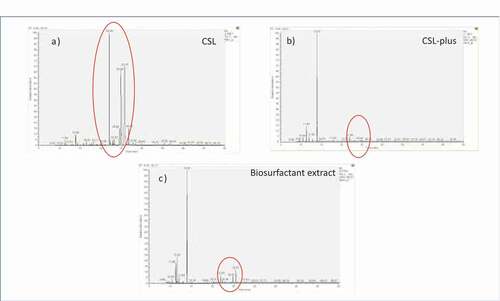
Figure 3. FTIR spectra of CSL and CSL-plus (a), the interphase (b), and the biosurfactant extract (c).
Figura 3. FTIR espectros de CSL y CSL-plus (a), la interfase (b), y el extracto de biosurfactante (c)
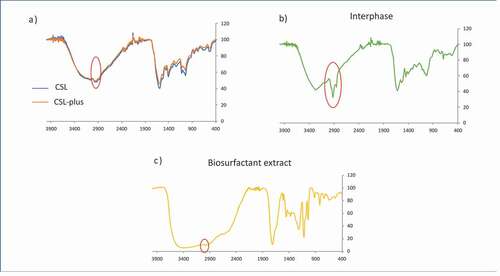
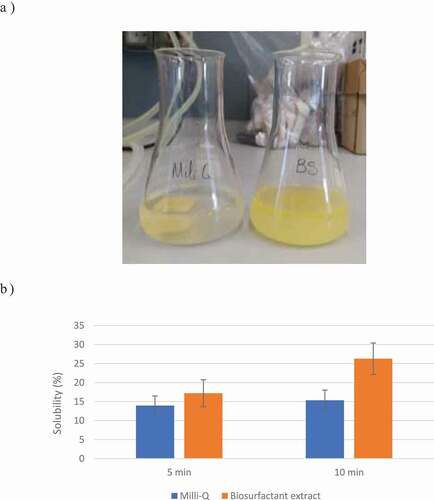
Figure 4. Macro view of the chicken broth cubes solubilization with Milli-Q water and biosurfactant solution, respectively (a); and the solubilization percentage obtained (b).
Figura 4. Visión macroscópica de la solubilización de los cubos de caldo de pollo en agua Milli-Q y disolución de extracto de biosurfactante, respectivamente (a); y el porcentaje de solubilización obtenido (b)