
Figures & data
Figure 1. Fresh fruits of Camellia oleifera.
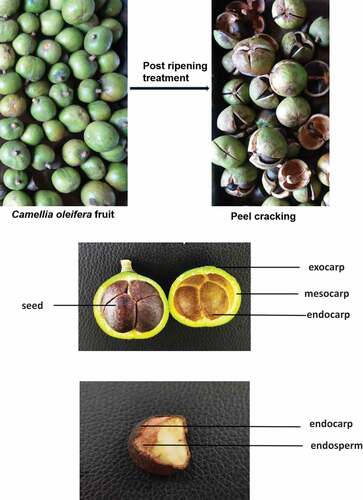
Figure 2. Composition of metabolites from Camellia oleifera fruits.
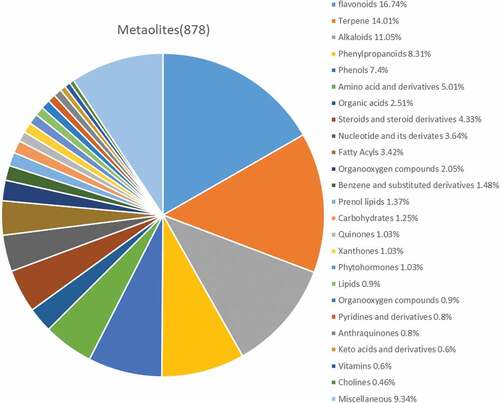
Figure 3. Score scatter plot for PCA model for Camellia oleifera fresh fruits.
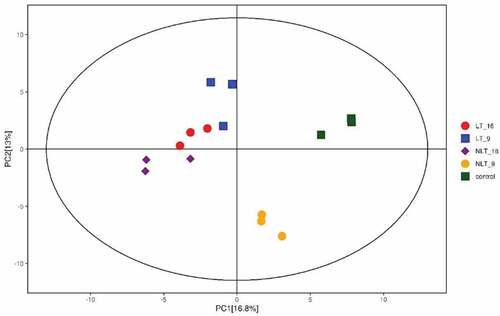
Figure 4. Heatmap of hierarchical clustering analysis for model for Camellia oleifera fresh fruits.
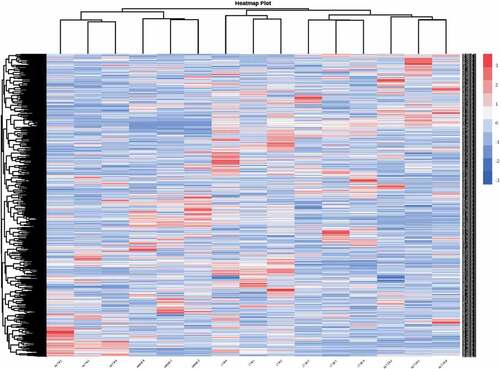
Figure 5. Permutation test of the OPLS-DA model for comparing the treatment groups of Camellia oleifera fresh fruits.(a,b,c,d,e,f,g,h: Permutation test of OPLS-DA model for group LT_9 vs Control, LT_16 vs Control, LT_16 vs LT_9, NLT_9 vs Control, NLT_9 vs LT_9, NLT_16 vs Control, NLT_16 vs LT_16, NLT_16 vs NLT_9.).
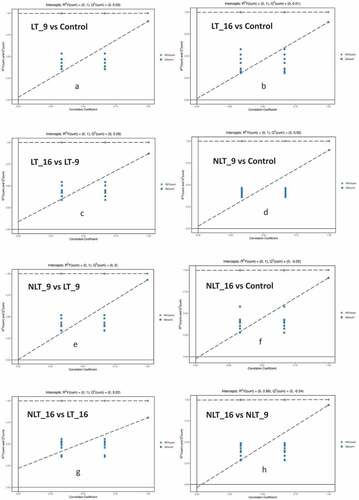
Figure 6. Volcano plot for comparing the treatment groups of Camellia oleifera fresh fruits.
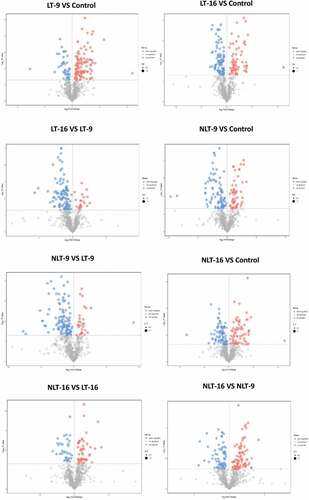
Table 1. Differential metabolites expression in the post-ripening treatment groups of C. oleifera fresh fruits.
Figure 7. Venn diagram indicating the differential and common metabolites in the post-ripening treatment groups of Camellia oleifera fresh fruits.
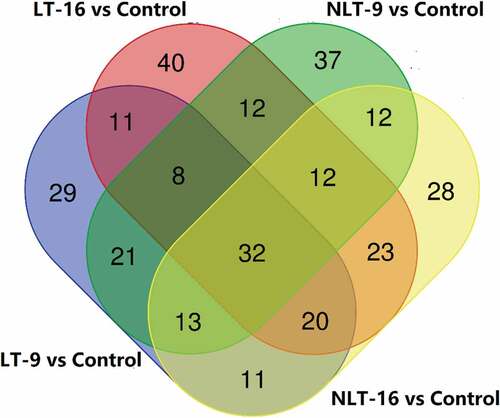
Table 2. 32 core differential metabolites in the post-ripening treatment groups of C. oleifera fresh fruits.
Table 3. Metabolic pathway enrichment information of differential metabolites in different comparison groups.
Data availability statement
All data generated or analyzed during this study are included in this published article and its supplementary information files.