Figures & data
Table 1. Orthogonal test design.
Figure 1. Influence of extrusion processing conditions on the reducing sugars in resistant starch rice. (a) Influence of material water content on rice reducing sugar. (b) Influence of reaction temperature on rice reducing sugar. (c) Influence of extrusion processing rotation on rice reducing sugars. (d) Influence of extrusion enzyme addition amount on the rice reducing sugars.
Table 2. Results of orthogonal test.
Table 3. Main basic composition (the percentage content of dry basis, unit: %).
Figure 2. Changes in resistant starch rice particles before and after extrusion. a)unextruded resistant starch rice particles. b) Extrusion resistant starch rice powder particles.
Figure 3. X-ray diffraction pattern of starch molecular crystal structure in the resistant starch rice particles before and after extrusion.
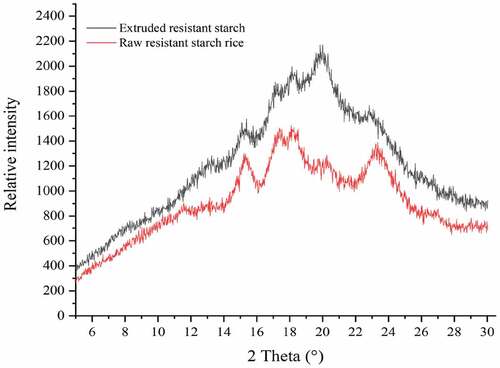
Table 4. Changes in thermodynamic properties before and after low-temperature extrusion.
Figure 4. Changes in the solubility of resistant starch rice before and after extrusion.
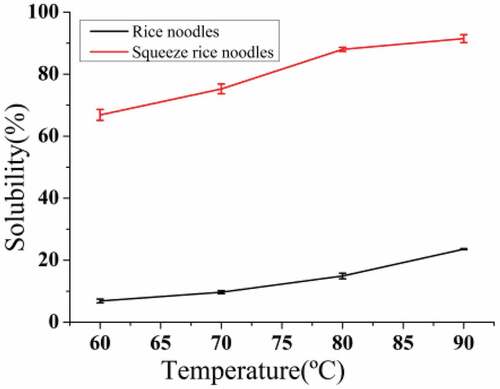
Table 5. Parallel experimental test results of the color indicator.
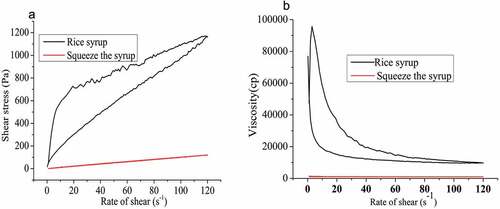
Figure 5. Plot of starch glycohydrodenosis. (a) Shear stress with shear rate. (b) Viscosity with shear rate.