936
Views
0
CrossRef citations to date
0
Altmetric
Research Article

Serum neuropeptide Y and peptide YY levels in response to ingestion of germinated brown rice in healthy adults

ORCID Icon, ORCID Icon & ORCID Icon
Pages 209-216 | Received 23 Aug 2022, Accepted 03 Mar 2023, Published online: 17 Mar 2023

Figures & data

Figure 1. The experimental protocol.

Figure 1. The experimental protocol.

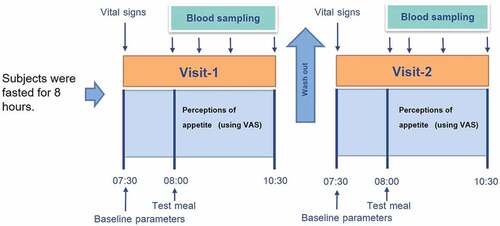
Table 1. The participant characteristics.

Figure 2. Plasma glucose and insulin after meal ingestion. The plasma glucose (a), the AUC of plasma glucose (b), the plasma insulin (c), and the AUC of plasma insulin (d). Data are expressed as the mean ± SEM. #p < .05 compared to baseline. NS; Not significant difference.

Figure 2. Plasma glucose and insulin after meal ingestion. The plasma glucose (a), the AUC of plasma glucose (b), the plasma insulin (c), and the AUC of plasma insulin (d). Data are expressed as the mean ± SEM. #p < .05 compared to baseline. NS; Not significant difference.

Figure 3. Serum NPY and PYY after meal ingestion. The serum NPY (a), AUC of serum NPY (b), serum PYY (c), and AUC of serum PYY (d). Data are expressed as the mean ± SEM. *p < .05 compared to WR, #p < .05 compared to baseline. NS; Not significant difference.

Figure 3. Serum NPY and PYY after meal ingestion. The serum NPY (a), AUC of serum NPY (b), serum PYY (c), and AUC of serum PYY (d). Data are expressed as the mean ± SEM. *p < .05 compared to WR, #p < .05 compared to baseline. NS; Not significant difference.

Figure 4. The hunger and fullness perception were evaluated by VAS questionnaires. The hunger perception (a), the AUC of hunger perception (b), the fullness perception (c), and the AUC of fullness perception (d). Data are expressed as the mean ± SEM. #p < .05 compared to baseline. NS; Not significant difference.

Figure 4. The hunger and fullness perception were evaluated by VAS questionnaires. The hunger perception (a), the AUC of hunger perception (b), the fullness perception (c), and the AUC of fullness perception (d). Data are expressed as the mean ± SEM. #p < .05 compared to baseline. NS; Not significant difference.

Data availability statement

The datasets used and/or analysed during the current study are available from the corresponding author upon reasonable request. https://doi.org/10.1080/19476337.2023.2188903.