Figures & data
Figure 1. Evolution of the solids content (°brix) in the concentrate and of the ice fraction as a function of the cryoconcentration cycles.
Table 1. Physicochemical parameters of fresh, evaporated, concentrated and their ice fractions whey.
Table 2. Proximal composition of fresh, evaporated and cryoconcentrated cycle 3 whey.
Table 3. Amino acid content of fresh, evaporated and cryoconcentrated cycle 3 whey.
Figure 2. FT-IR spectra of protein secondary structure in fresh, evaporated and cryoconcentrated whey.
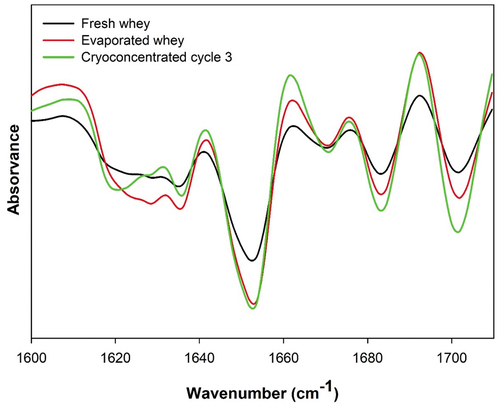
Table 4. Percentages of protein secondary structure of fresh, evaporated and cryoconcentrated cycle 3 whey.
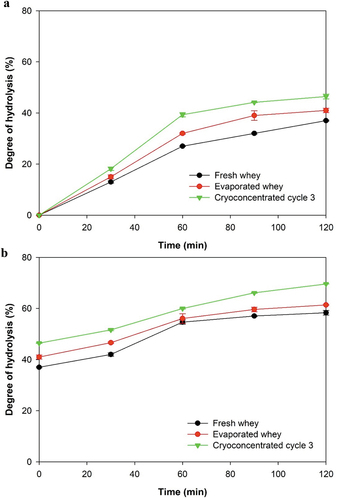
Figure 3. Degree of hydrolysis of fresh, evaporated and cryoconcentrated cycle 3 whey. (a) gastric process; (b) intestinal process.