
Figures & data
Figure 1. The manufacturing process of Zaopocu.
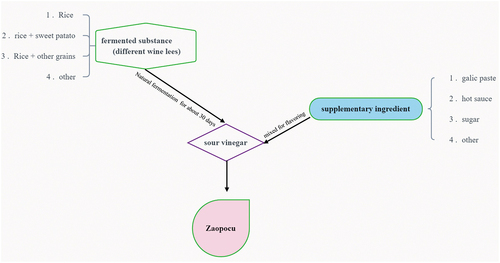
Table 1. The characteristics of collected three types of Zaopocu samples.
Figure 2. The physicochemical properties of the three types of ZPC. (a) TA. (b) Lactic acid content. (c) Amino Acid content. (d) Nitrite content. (e) pH. (f) Salinity. (g) Reducing sugar content. *P < .05, **P < .01, ***P < .001, ns= no significant.
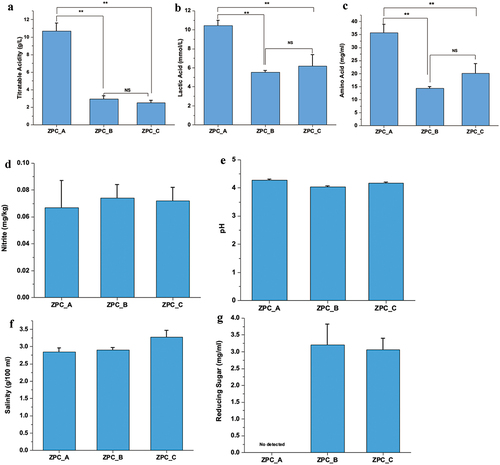
Table 2. The physicochemical properties of 12 ZPC samples.
Figure 3. Rarefaction curves of observed species number.
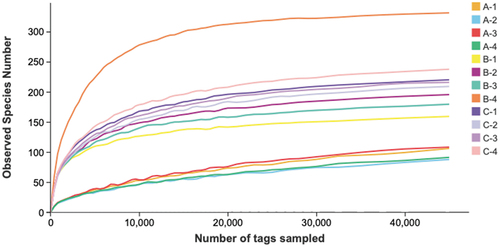
Figure 4. Comparison of alpha diversity indices among the three types of ZPC. (a) Shannon. (b) Simpson. (c) ACE. (d) Chao 1.*P < .05, **P < .01, ***P < .001, “ns” = not significant.
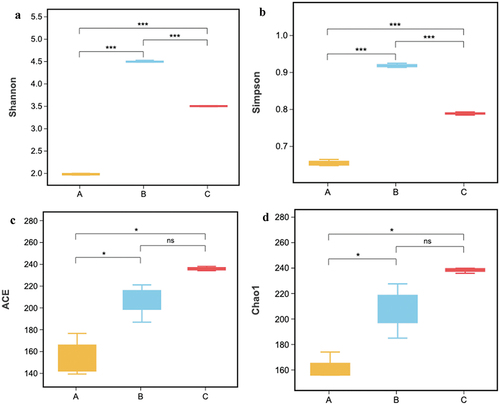
Table 3. Sequence data information and alpha diversity index of 12 ZPC samples.
Figure 5. Relative abundance (Top 10) of bacteria among the three types of ZPC samples at phylum (a,b), genus (c,d), and species (e,f) level.
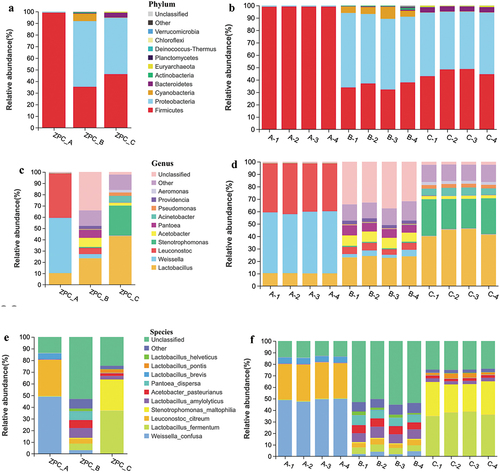
Figure 6. Venn diagram (a) and Upset plots (b) for the shared/unique OTUs information.
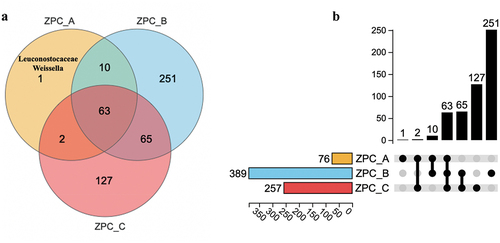
Figure 7. PCA analysis of the bacteria communities of the three types of ZPC samples based on OTU level.
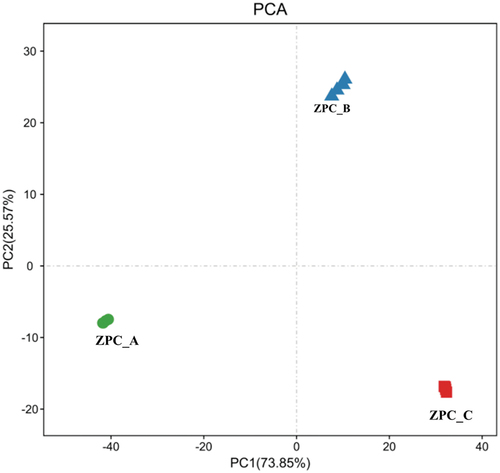
Figure 8. Comparison of differences and similarity of the bacterial community structures among three types of ZPC samples by Cluster-tree. The clustering map was based on OTUs pattern and weighted_Unifrac distance.
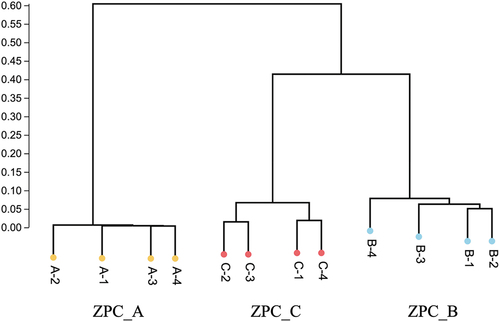
Figure 9. LEfSe analyses the biomarker among the three types ZPCs. (a) The cladogram shows the abundance of different taxa in ZPC samples. (b) Histogram results with a threshold ≥ 4.
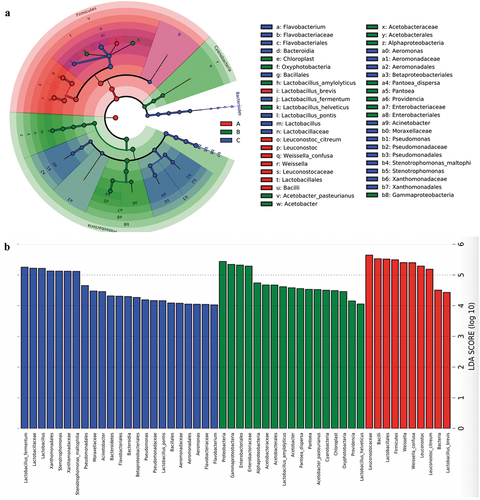
Figure 10. Bacterial function prediction by PICRUSt. (a) The heatmap analysis of the 10 substance metabolism pathways at level 2. (b) Statistical analysis of the metabolic pathways by the Turkey HSD test. *P < .05, ***P < .001, “ns”= not significant. (c) the heatmap analysis (level 3) of the functional pathways associated with human disease. ***P < .001 when compared with ZPC_B and ZPC_C.
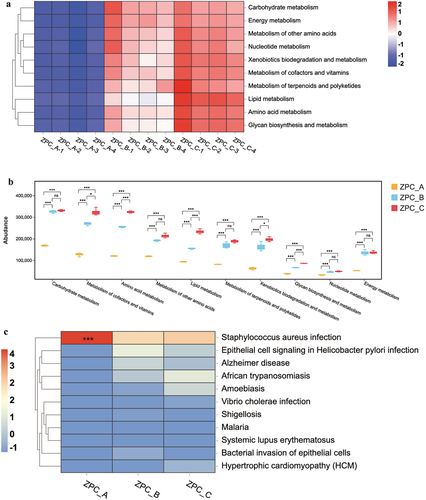
Figure 11. Prediction of microbial community phenotypes using the BugBase at the phylum level among three ZPC groups. *P < .05.
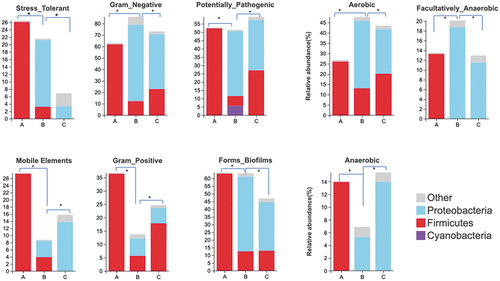
Figure 12. Canonical correlation analysis (CCA) of three types of ZPC samples.
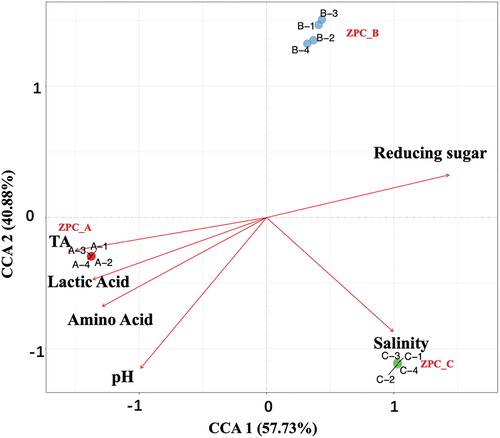
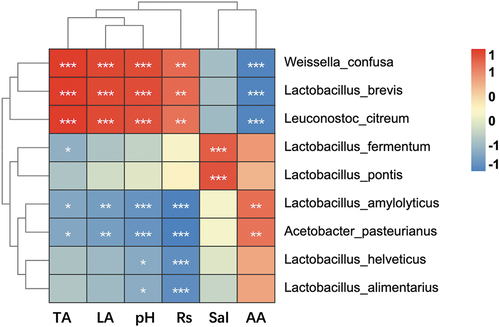
Figure 13. Spearman correlations analysis of the specific LAB and physicochemical characteristics. Red and blue represent positive and negative correlations, respectively. *P < .05, **P < .01, ***P < . 001.Rs = Reducing sugar. Sal = salinity.
Data availability statement
The datasets analyzed for High-throughput sequencing during the current study are available on a online platform (http://www.omicsmart.com), Details of access can be obtained from the corresponding author upon reasonable request.