Figures & data
Table 1. Proximate composition of oven-dried soursop fruit pulp and seed.
Figure 1. The antioxidant activities (DPPH and ABTS) of oven- and solar-dried soursop seeds, pulp, and peel. Different letters on bars with the same pattern indicate significant differences (p < .05; n = 6).
Figure 2. FRAP and phenolic activity of oven- and solar-dried soursop seeds, pulp, and peel. Different letters on bars indicate significant differences (p < .05; n = 6).
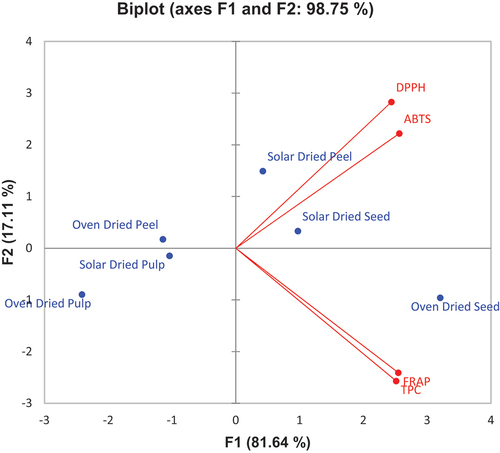
Table 2. Correlation between TPC, DPPH, ABTS acid scavenging activity, and FRAP.
Figure 3. PCA among the antioxidant properties. TPC = total phenolic content; DPPH = 2,2-diphenyl-1-picrylhydrazyl; FRAP = ferric reducing antioxidant power; ABTS = 2,2'-azino-bis(3-ethylbenzothiazoline-6-sulfonic acid).