Figures & data
Table 1. Ingredient composition of W/O/W emulsion for each treatment.
Figure 1. Creaming index of double emulsion W/O/W vitamin C during storage.
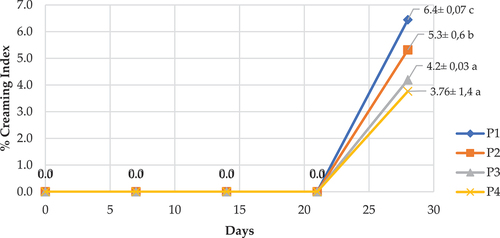
Figure 2. Morphology of the double emulsion of vitamin C in sample P3 (MCC = 2%) (a) morphology of double emulsion before drying, (b) morphology of spray-dried double emulsion after rehydration.
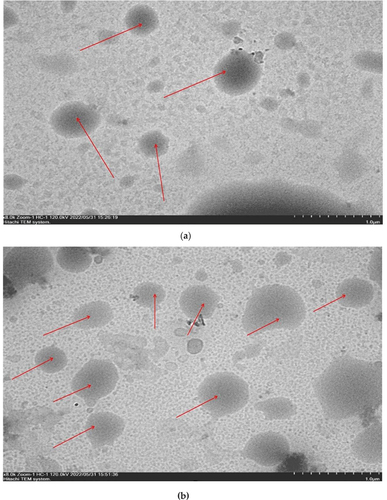
Figure 3. Value of n (flow behaviour index) of double emulsion vitamin C at various treatment.
Table 2. Zeta potential double emulsion Pickering W/O/W (water-in-oil-in-water) vitamin C at various storage.
Table 3. The vitamin C double emulsion particle size assay with Pickering of MCC.
Figure 4. Morphology of vitamin C double emulsion microcapsules after drying.
Table 4. Particle size of spray dried vitamin C double emulsion after rehydration.
Table 5. aw and moisture content of spray dried vitamin C double emulsion.
Figure 5. Hygroscopicity rate of spray dried vitamin C double emulsion.
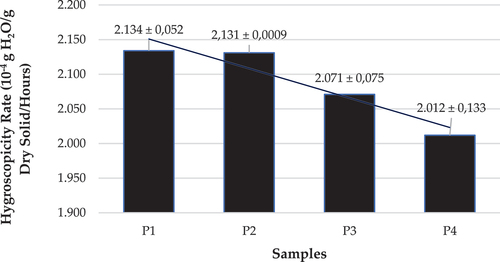
Figure 6. Percentage solubility of spray dried vitamin C double emulsion.
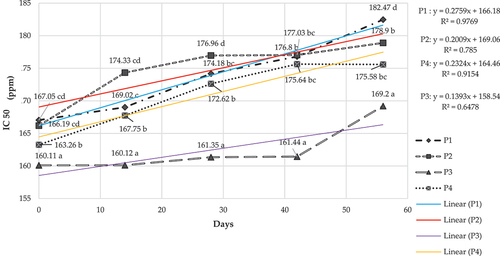
Figure 7. IC50 value of spray dried vitamin C double emulsion during storage.