
Figures & data
Table 1. The flowchart of the experimental protocol. NG, normal group; MG, model group; LP1, gavage 10 mL/kg (body weight) of L. plantarum SCS5 suspension; LP2, gavage 10 mL/kg (body weight) of L. plantarum SCS5 intracellular material; LP3, gavage 10 mL/kg (body weight) of L. plantarum SCS5 heat-killed intracellular material; STZ, intraperitoneal injection of 50 mg/kg (body weight) STZ for 5 days.
Figure 1. Body weight changes of mice between different groups. Normal group (NG), STZ treatment group (MG); STZ + L. plantarum SCS5 suspension group (LP1); STZ + L. plantarum SCS5 intracellular material group (LP2); STZ + L. plantarum SCS5 heat-killed intracellular material group (LP3). *Values compared with MG mice are significantly different at p < .05.
Figure 2. Changes in fasting blood glucose level. Normal group (NG); STZ treatment group (MG); STZ + L. plantarum SCS5 suspension group (LP1); STZ + L. plantarum SCS5 intracellular material group (LP2); STZ + L. plantarum SCS5 heat-killed intracellular material group (LP3). *Values compared with other groups mice are significantly different at p < .05.
Figure 3. Changes in blood glucose levels and oral glucose tolerance. a,b before the experiment, c,d at the end of the experiment, oral glucose tolerance of experimental mice after 13 weeks of administration of L. plantarum SCS5, and blood glucose levels measured at 0, 30, 60, 90 and 120 min respectively. At the same time, the area under the curve of the drawn curve is calculated. Normal group (NG); STZ treatment group (MG); STZ + L. plantarum SCS5 suspension group (LP1); STZ + L. plantarum SCS5 intracellular material group (LP2); STZ + L. plantarum SCS5 heat-killed intracellular material group (LP3). *Values compared with NG mice are significantly different at p < .05. #Values compared with MG mice are significantly different at p < .05.
Figure 4. HbA1c level in serum of experimental mice. HbA1c level of experimental mice given L. plantarum SCS5 at week 13. Normal group (NG); STZ treatment group (MG); STZ + L. plantarum SCS5 suspension group (LP1); STZ + L. plantarum SCS5 intracellular material group (LP2); STZ + L. plantarum SCS5 heat-killed intracellular material group (LP3). a,bValues in the same column with different superscript letters significantly differ at p < .05.
Figure 5. Change of INS levels in pancreas of mice during the experiments. INS level of experimental mice given L. plantarum SCS5 at week 13. Normal group (NG); STZ treatment group (MG); STZ + L. plantarum SCS5 suspension group (LP1); STZ + L. plantarum SCS5 intracellular material group (LP2); STZ + L. plantarum SCS5 intracellular heat-killed material group (LP3). a,bValues in the same column with different superscript letters significantly differ at p < .05.
Figure 6. MDA level in serum of experimental mice. MDA level of experimental mice given L. plantarum SCS5 at week 13. Normal group (NG); STZ treatment group (MG); STZ + L. plantarum SCS5 suspension group (LP1); STZ + L. plantarum SCS5 intracellular material group (LP2); STZ + L. plantarum SCS5 heat-killed intracellular material group (LP3). a,bValues in the same column with different superscript letters significantly differ at p < .05.
Figure 7. SOD (a),CAT (b),GPx (c),HO-1 (d),GSH (e) levels in pancreas of mice. Normal group (NG); STZ treatment group (MG); STZ + L. plantarum SCS5 suspension group (LP1); STZ + L. plantarum SCS5 intracellular material group (LP2); STZ + L. plantarum SCS5 heat-killed intracellular material group (LP3). a,bValues in the same column with different superscript letters significantly differ at p < .05.
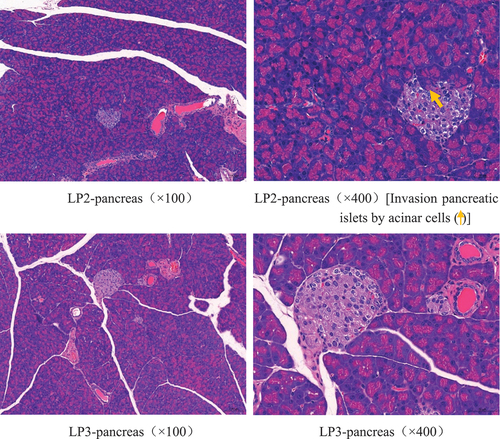
Figure 8. H & E pathological observation of mouse pancreas(a-d). Normal group (NG); STZ treatment group (MG); STZ + L. plantarum SCS5 suspension group (LP1); STZ + L. plantarum SCS5 intracellular material group (LP2); STZ + L. plantarum SCS5 heat-killed intracellular material group (LP3).
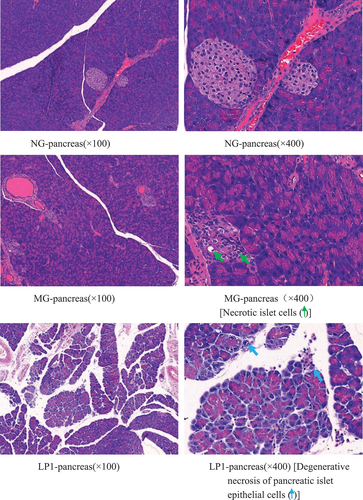
Figure 8. (Continued).
Data availability statement
The datasets generated for this study are available upon request to the corresponding author.