Figures & data
Table 1. Unsaturated fatty acid profiles of infant formula during storage (g/100 g).
Table 2. Unsaturated fatty acid profiles of follow-up infant formula during storage (g/100 g).
Table 3. Unsaturated fatty acid profiles of young children formula during storage (g/100 g).
Figure 1. Vitamin E and vitamin C content of the analyzed samples.
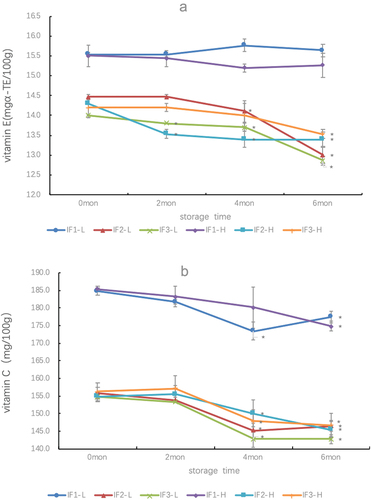
Table 4. TBARS contents of IFs stored at different storage time (λ = 532 nm absorbance).
Figure 2. Cluster analysis of the formulas after 6 months of storage data (VOCs) as obtained by the GC-MS analysis. (a) IF1 (infant formula), (b) IF2 (follow-up infant formula) and (c) IF3 (young children formula). Each sample has been analyzed in triplicates.
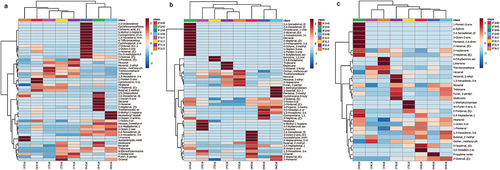
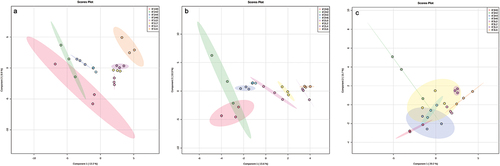
Figure 3. PLS-DA of the formulas after 6 months of storage data (VOCs) as obtained by the GC-MS analysis. (a) IF1 (infant formula), (b) IF2 (follow-up infant formula) and (c) IF3 (young children formula). Each sample has been analyzed in triplicates.