Figures & data
Figure 1. TEM image of Au@CD-MOF dissolved in water (a); UV-vis absorbance spectra and photographs of Au@CD-MOF dissolved in water for different times (b); Zeta potential of T-AuNPs and Au@CD-MOF dissolved in water (c).
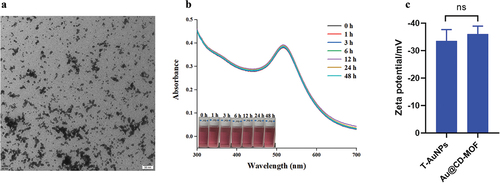
Figure 2. Optical images of agar plates characteristic of antibacterial activities of Au@CD-MOF against S. aureus under 12 h and 24 h and bacterial solution of the control group was prediluted 103 times (a); Bacterial time-inactivate profiles of Au@CD-MOF against S. aureus (b); inactivated bacterial count of Au@CD-MOF against S. aureus (c).
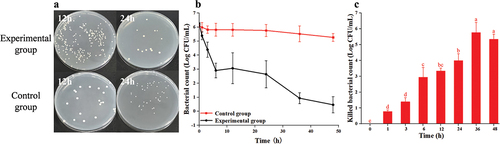
Figure 3. Optical images of agar plates characteristic of antibacterial activities of Au@CD-MOF against L. monocytogenes under 12 h and 24 h and bacterial solution of the control group was prediluted 103 times (a); Bacterial time-inactivate profiles of Au@CD-MOF against L. monocytogenes (b); inactivated bacterial count of Au@CD-MOF against L. monocytogenes (c).
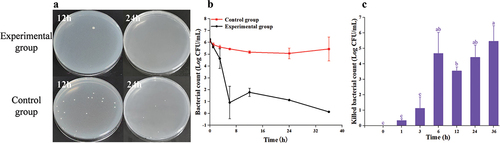
Figure 4. Optical images of agar plates characteristic of antibacterial activities of Au@CD-MOF against E. coli O157:H7 under 12 h and 24 h and bacterial solution of the control group was prediluted 103 times (a); Bacterial time-inactivate profiles of Au@CD-MOF against E. coli O157:H7 (b); inactivated bacterial count of Au@CD-MOF against E. coli O157:H7 (c).
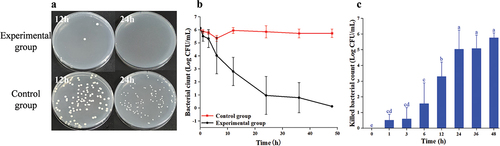
Figure 5. Optical images of agar plates characteristic of antibacterial activities of Au@CD-MOF against P. aeruginosa PAO1 under 12 h and 24 h and bacterial solution of the control group was prediluted 103 times (a); Bacterial time-inactivate profiles of Au@CD-MOF against P. aeruginosa PAO1 (b); inactivated bacterial count of Au@CD-MOF against P. aeruginosa PAO1 (c).
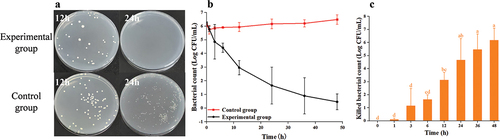
Figure 6. Optical images of agar plates characteristic of antibacterial activities of Au@CD-MOF against S. typhimuriumunder 12 h and 24 h and bacterial solution of the control group was prediluted 103 times (a); Bacterial time-inactivate profiles of Au@CD-MOF against S. typhimuriumunder (b); inactivated bacterial count of Au@CD-MOF against S. typhimuriumunder (c).
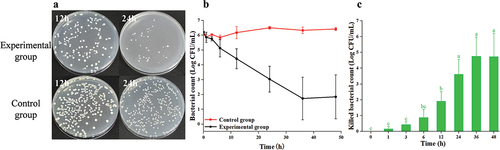
Figure 7. SEM images of E. coli O157:H7 control group (a) and experimental group (b); SEM images of S. aureus control group (c) and experimental group (d).
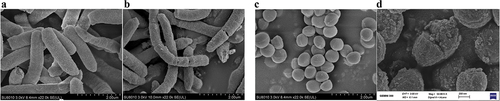
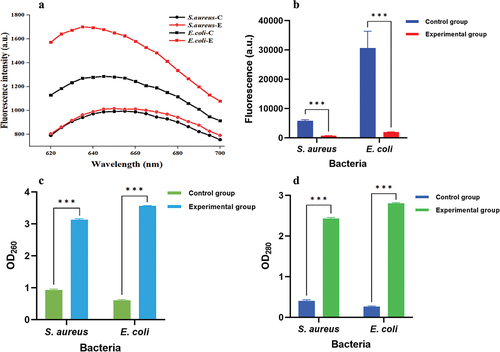
Figure 8. PI fluorescence spectrum of E. coli O157:H7 and S. aureus which were treated with Au@CD-MOF for 24 h (a); Rh 123 fluorescence spectrum of E. coli O157:H7 and S. aureus which were treated with Au@CD-MOF for 24 h (b); optical density at 260 nm (c) and 280 nm (d) of E. coli O157:H7 and S. aureus which were treated with Au@CD-MOF for 24 h.