Figures & data
Table 1. Ham formulations, control and added with extracts obtained by MAE optimized conditions from avocado residual pulp (ARP) at 0.5, 1 and 1.5% (w/w).
Table 2. 3k-p factorial design with responses for total soluble polyphenols (TSP) and antioxidant capacity indices (FRAP and DPPH) of extracts obtained by microwave-assisted extraction (MAE) from avocado residual paste (ARP).
Table 3. Analysis of variance of the regression model for the content of phenolic compounds, antioxidant activity measured by DPPH and FRAP in avocado residual paste (ARP).
Figure 1. Response surface plot for total soluble polyphenols (TSP), as phenolic compounds, of extracts obtained by microwave-assisted extraction (MAE) of avocado residual paste (ARP). (a) Effect of solvent ratio (XS1), and microwave power (XP2); (b) Effect of extraction time (Xt3), and microwave power (XP2).
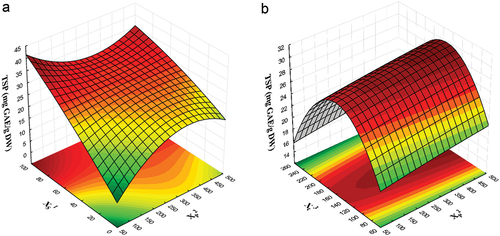
Figure 2. Response surface plot for antioxidant capacity indices of extracts obtained by microwave-assisted extraction (MAE) of avocado residual paste (ARP). (a) Effect of solvent ratio (XS1), and microwave power (XP2) over DPPH; (b) Effect of extraction time (Xt3), and microwave power (XP2) over DPPH; (c) Effect of solvent ratio (XS1), and microwave power (XP2) over FRAP; (d) Effect of extraction time (Xt3), and microwave power (XP2) over FRAP.
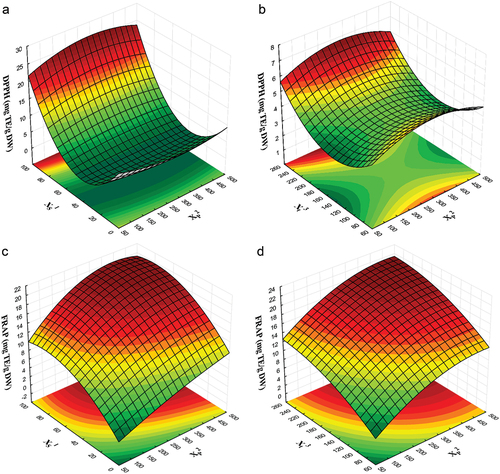
Table 4. Experimental validation of predicted values at optimal conditions for microwave-assisted extraction (MAE) of total soluble polyphenols (TSP) and antioxidant capacity indices (DPPH and FRAP) from avocado residual paste (ARP).
Figure 3. Color parameters evaluated in the formulated hams. Control: ham without added extract; T-0.5%: ham with the addition of 0.5% extract; T-1.0%: ham with the addition of 1% extract; T-1.5%: ham with the addition of 1.5% extract. Different literals in each parameter indicate significant differences (p ≤ .05).
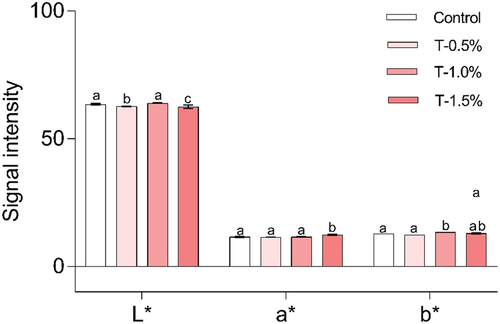
Figure 4. Total soluble polyphenols (TSP) content in the formulated hams. Control: ham without added extract; T-0.5%: ham with the addition of 0.5% extract; T-1.0%: ham with the addition of 1% extract; T-1.5%: ham with the addition of 1.5% extract. Different literals indicate differences (p ≤ .05).
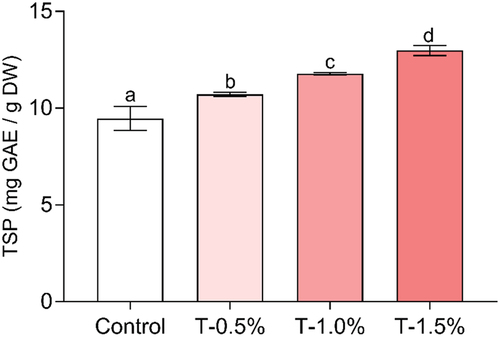
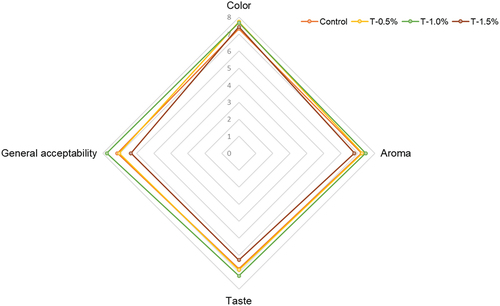
Figure 5. Sensory scores for cooked ham (control) and formulations added with extracts (0.5, 1 and 1.5% w/w) obtained by microwave-assisted extraction (MAE) of avocado residual paste (ARP).