Figures & data
Figure 1. Pituranthos chloranthus.
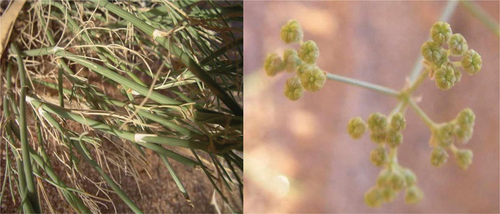
Table 1. LC/MS detection parameters for analysed compounds in P. chloranthus (negative and positive ionization mode) (n = 3).
Table 2. Phytochemical test of aqueous extract of P. chloranthus.
Figure 2. Calibration curve for gallic acid (total phenols) and quercetin (flavonoids).
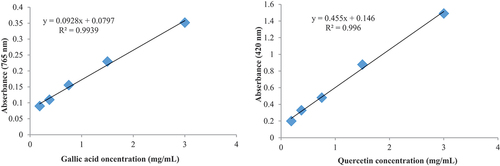
Table 3. The concentration (µg/mg extract) of major phenolic compounds identified by HPLC in extracts of P. chloranthus (n = 3).
Figure 3. HPLC profile of the ethyl acetate fraction of P. chloranthus.
Figure 4. UPLC-ISI/MS profiles for the phenolic compounds detected in the aqueous extract of P. chloranthus.
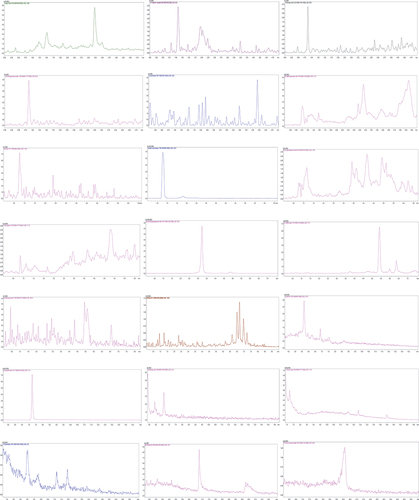
Figure 5. Evolution of weight (g) of rats treated with P. chloranthus extract.
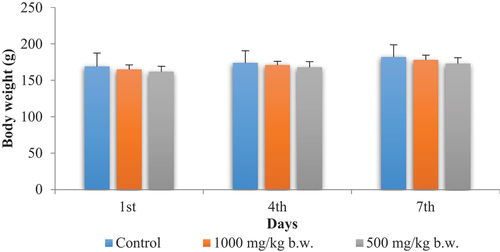
Figure 6. Evolution of body weight (g) of treated and control rats during the experiment.
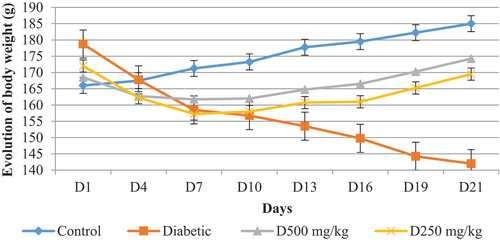
Figure 7. Evolution of blood sugar (g/l) for all batches of rats during the experiment.
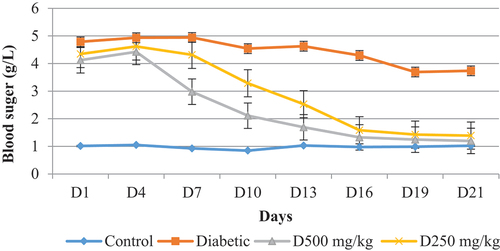
Figure 8. Variation in the weight of internal organs of female rats after sacrifice.
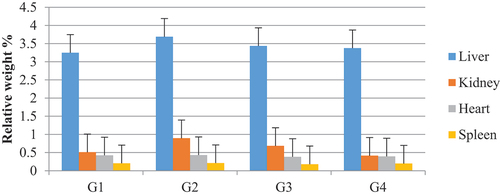
Table 4. Biochemical parameters.
Figure 9. Circle of correlations, projection of variables on the plane (1x2).
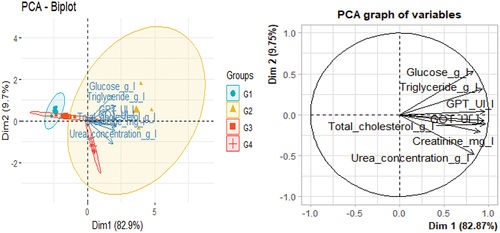
Figure 10. Combination analysis between PCA and ANOVA of the biochemical parameters of the studied groups.
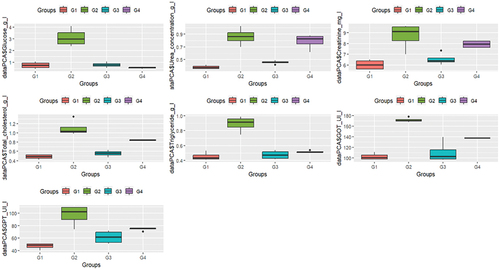
Figure 11. Histological section of the different organs of treated and untreated individuals (G: 40x10) (BC: Blood congestion; VC: Vacuolization of the cytoplasm).
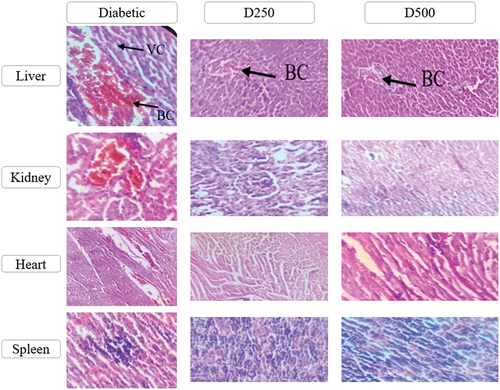
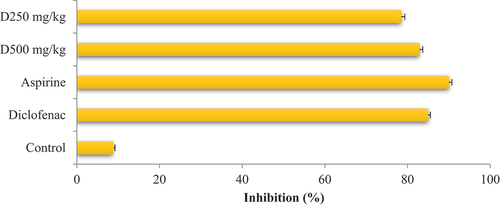
Figure 12. Inhibition rate (%) of different standards in comparison with P. chloranthus extract.