Figures & data
Figure 1. Illustrates the impact of OA on cholesterol synthesis in HepG2 cells. The chemical structure of OA is depicted in (a). Cell viability was assessed after a six-hour treatment with different concentrations of OA in HepG2 cells (b). The results revealed a significant inhibition of cholesterol levels by OA in HepG2 cells after both 6 hours (c) of treatment. To investigate long-term effects, HepG2 cells were exposed to OA for eight days with or without cholesterol supplementation. The absorbance at 560 nm was measured after removing crystal violet with 5% SDS (d). Effects of OA treatment on HepG2 cell morphology after 8 days (e). Comparing the upper layer cells, which were untreated, treated with 10 μM OA, or treated with 10 μM lovastatin, with the lower layer cells that received concurrent supplementation of 10 μg/mL cholesterol provided insights into the effects of OA and cholesterol. The abbreviations used are as follows: OA for oleanolic acid and CHOL for cholesterol. Statistical analysis revealed significance with *p < .05, **p < .01, ***p < .001 compared to the control group, and #p < .05, ##p < .01, ###p < .001 compared to the cholesterol group. The presented data represent the mean ± standard error of at least three replicates. Statistical comparisons were made against the OA 0 μM group (*p < .05, **p < .01, ***p < .001).
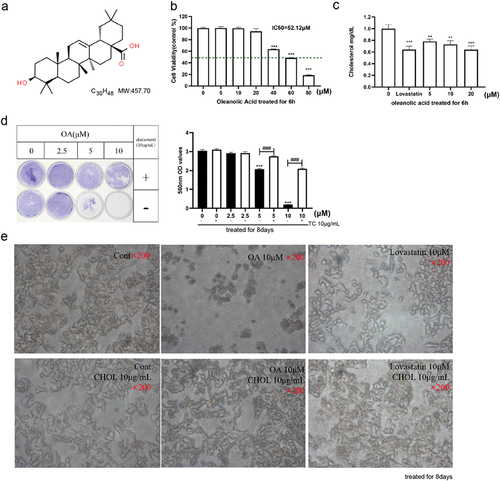
Figure 2. Impact of OA on key enzyme protein levels involved in cholesterol synthesis in HepG2 cells. (a) Effect of OA on the expression of ACLY, HMGCR, SQLE, DHCR7, DHCR24 proteins in HepG2 cells. (b) Quantification chart of the effect of OA on ACLY protein expression in HepG2 cells. (c) Quantification chart of the effect of OA on HMGCR protein expression in HepG2 cells. (d) Quantification chart of the effect of OA on SQLE protein expression in HepG2 cells. (e) Quantification chart of the effect of OA on DHCR7 protein expression in HepG2 cells. (f) Quantification chart of the effect of OA on DHCR24 protein expression in HepG2 cells. Statistics: values are means±SEM (n=3), *p < .05, ** p <.01, *** p < .001. OA, oleanolic acid.
Figure 3. The influence of OA on SREBP2/HMGCR protein levels. (a) Effect and quantification of OA on HMGCR protein expression in HepG2 cells. (b) Effect and quantification of OA on SREBP-2 protein expression in HepG2 cells. (c) Influence of OA on HMGCR gene expression in HepG2 cells. (d) Impact of OA on SREBP2 protein expression in HepG2 cells. Statistics: values are means±SEM (n=3), *p < .05, **p < .01, ***p < .001. OA, oleanolic acid.
Figure 4. OA reduces HMGCR enzyme activity through the AMPK signaling pathway. (a) Influence of different concentrations of OA compared to lovastatin on the inhibition rate of HMGCR enzyme activity. (b) Impact of OA on HMGCR and p-HMGCR protein levels in HepG2 cells. (c) Effect of OA on AMPK and p-AMPK protein levels in HepG2 cells. Statistics: *p < .05, **p < .01, ***p < .001 versus the control group; ns, not significant (p > .05). OA, oleanolic acid; HMGCR, 3-hydroxy-3-methylglutaryl-coenzyme a reductase.
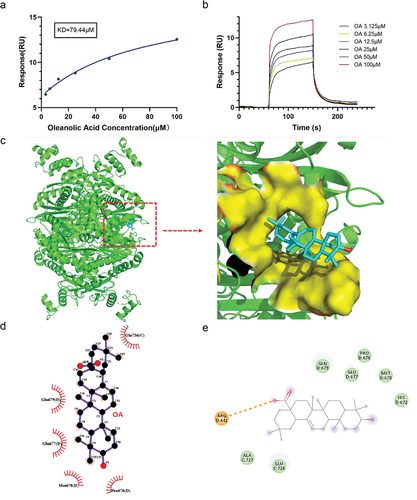
Figure 5. OA inhibits enzyme activity by directly binding to HMGCR through hydrophobic interactions. (a) Binding/dissociation/dissociation curves of different concentrations of OA with HMGCR. (b) Affinity size between OA and HMGCR. (c) The 3D docking result of OA with HMGCR. (d) Analysis of the internal forces of OA-HMGCR using Ligplot+ software. (e) Analysis of the internal forces of OA-HMGCR using discovery Studio™ software.