Figures & data
Table 1. Agronomic details of various Cicer species used in this study.
Table 2. Statistics of hydrolysis of chickpea protein with different enzymes.
Figure 1. Sodium dodecyl sulfate-polyacrylamide gel electrophoresis separation of Cicer seed protein isolates.
Figure 2. Schematic representation of production of hydrolysate catalyzed by different proteases in various Cicer species.
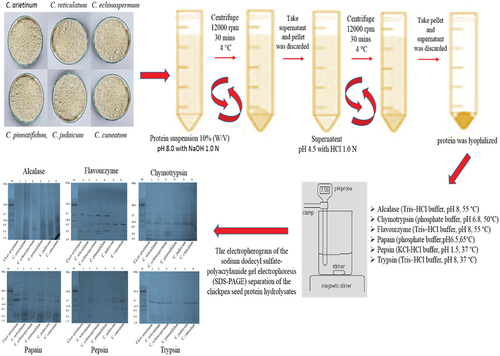
Figure 3. Sodium dodecyl sulfate-polyacrylamide gel electrophoresis separation of seed protein isolates of various Cicer species and hydrolysates produced using the following enzymes (a) alcalase (b) flavourzyme (c) chymotrypsin (d) papain (e) pepsin and (f) trypsin.
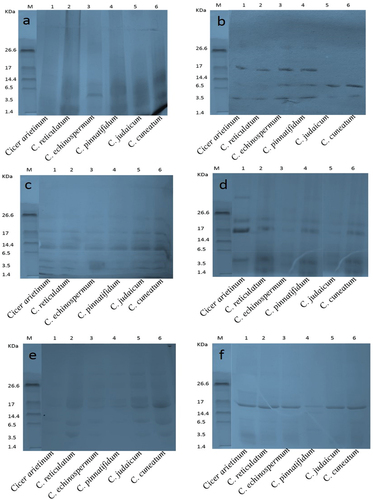
Figure 4. C. arietinum protein hydrolysates generated by different enzymes: (a) time course (degree of hydrolysis) of hydrolysis catalyzed by different proteases (b) maximum degree of hydrolysis achieved by different proteases. Values are means ±standard deviations (SDs) of three determinations.
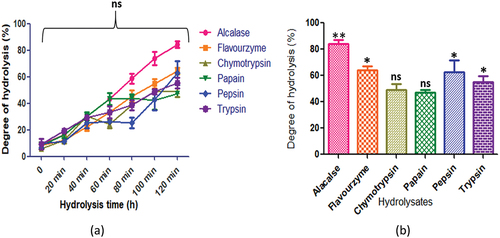
Figure 5. C. reticulatum protein hydrolysates generated by different enzymes: (a) time course (degree of hydrolysis) of hydrolysis catalyzed by different proteases (b) maximum degree of hydrolysis achieved by different proteases. Values are means ±standard deviations (SDs) of three determinations.
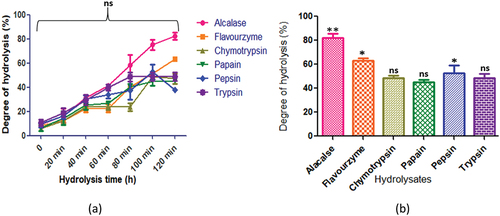
Figure 6. C. echinospermum protein hydrolysates generated by different enzymes: (a) time course (degree of hydrolysis) of hydrolysis catalyzed by different proteases (b) maximum degree of hydrolysis achieved by different proteases. Values are means ±standard deviations (SDs) of three determinations.
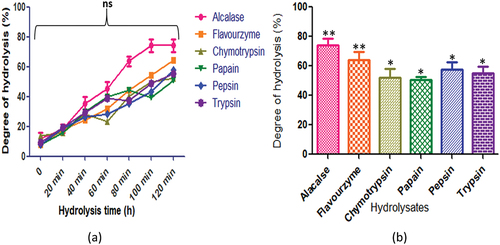
Figure 7. C. pinnatifidum protein hydrolysates generated by different enzymes: (a) time course (degree of hydrolysis) of hydrolysis catalyzed by different proteases (b) maximum degree of hydrolysis achieved by different proteases. Values are means standard deviations (SDs) of three determinations.
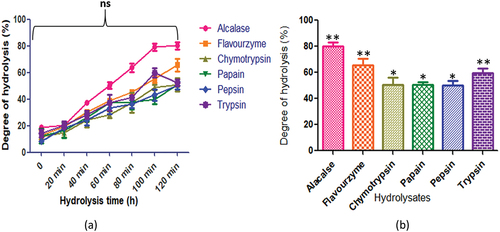
Figure 8. C. judaicum protein hydrolysates generated by different enzymes: (a) time course (degree of hydrolysis) of hydrolysis catalyzed by different proteases (b) maximum degree of hydrolysis achieved by different proteases. Values are means standard deviations (SDs) of three determinations.
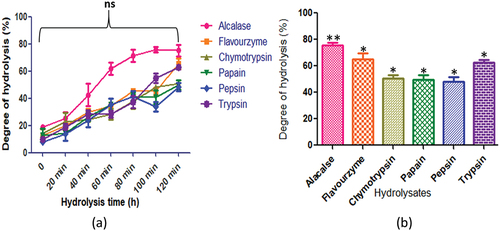
Figure 9. C. cuneatum protein hydrolysates generated by different enzymes: (a) time course (degree of hydrolysis) of hydrolysis catalyzed by different proteases (b) maximum degree of hydrolysis achieved by different proteases. Values are means standard deviations (SDs) of three determination.
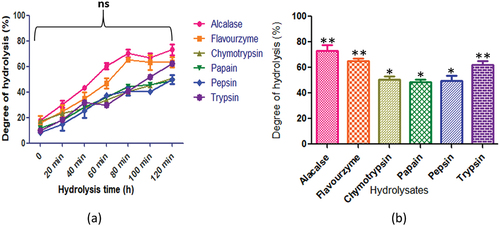
Figure 10. Elution profiles of CPH from Sephadex G-50, after treatment with alcalase, flavourzyme, chymotrypsin, papain, pepsin and trypsin, respectively.
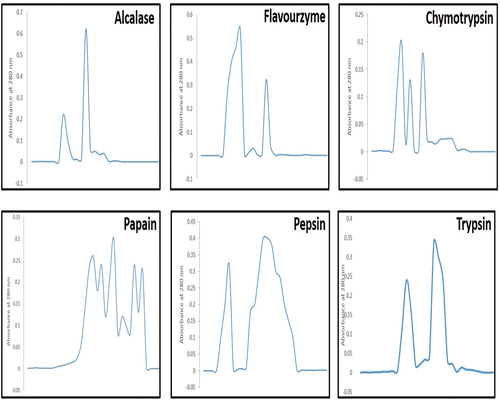
Figure 11. Radical-scavenging ability of CPH generated by various proteases after 2 h of incubation. Panels (a–f) correspond to Cicer arietinum, C. reticulatum, C. echinospermum, C. pinnatifidum, C. judaicum and C. cuneatum.
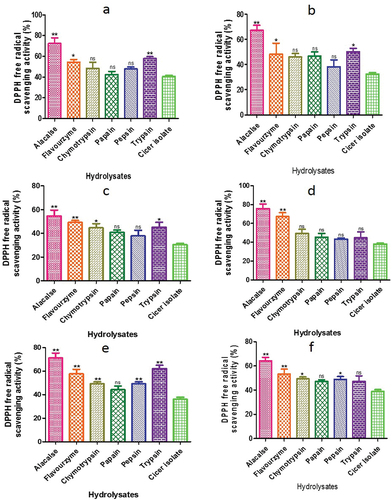
Figure 12. ß - carotene bleaching assay of CPH generated by various proteases after 2 h of respectively incubation. Panels (a–f) refer to Cicer arietinum, C. reticulatum, C. echinospermum, C. pinnatifidum, C. judaicum and C. cuneatum, respectively.
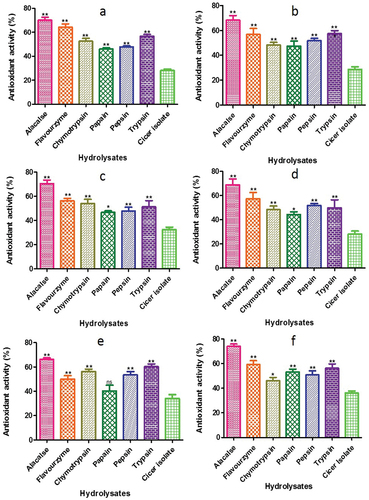
Figure 13. Reducing power assay of CPH generated by various proteases after 2 h of incubation. Panels (a–f) refer to Cicer arietinum, C. reticulatum, C. echinospermum, C. pinnatifidum,C. judaicum and C. cuneatum, respectively.
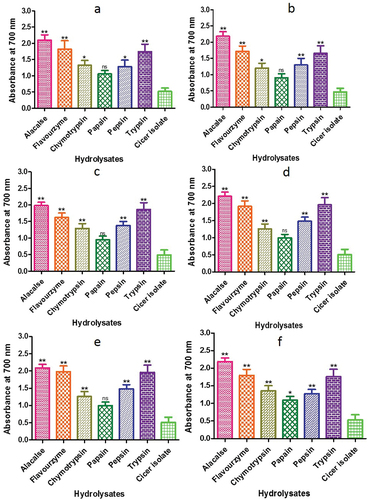
Figure 14. Metal chelating activity of CPH generated by various proteases after 2 h of incubation. Panels (a–f) refer to Cicer arietinum, C. reticulatum, C. echinospermum, C. pinnatifidum, C. judaicum and C. cuneatum respectively.
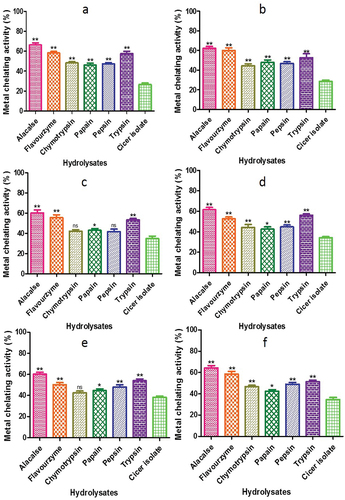
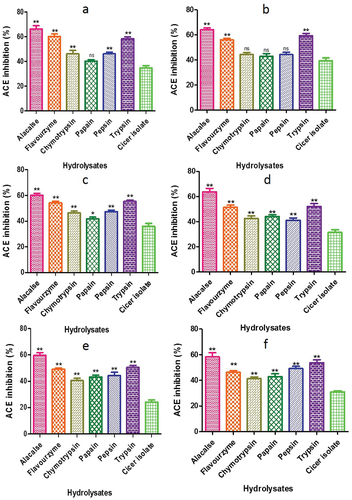
Figure 15. ACE inhibitory activity of CPH generated by various proteases after 2 h of incubation. Panels (a–f) refer to Cicer arietinum, C. reticulatum, C. echinospermum, C. pinnatifidum, C. judaicum and C. cuneatum, respectively.