Figures & data
Table 1. Characteristics of clinical samples and data.
Figure 1. The secretion of Bacillus toyonensis BV-17 quickly kills tumor cells. (a) The top 10 relative abundance at the phylum level in the two groups. (b) The scatter plot of genus Bacillus OTU numbers in the two groups (***p < .001, unpaired student’s t test, data were from the mean with SEM). (c) LDH release assay is used to measure the cell lysis of supernatants from different bacteria. Data are from the mean with SD in triplicates. (d) The cell lysis of B. toyonensis BV-17 supernatants is dose-dependent. The different volumes of supernatant (0 µl to 10 µl) are added to the 100 µl cell culture medium incubating for 30 min. Data are from the mean with SD in triplicates. (e) The membrane damage of cells is shown by an indirect immunofluorescent assay.
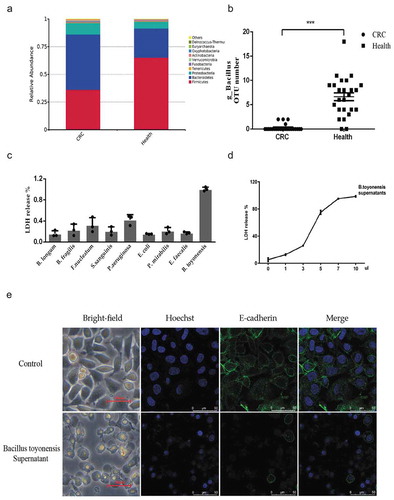
Table 2. Main toxins in the 23rd, 24th, and 25th fractions by mass spectroscopy analysis.
Figure 2. Identification of the effectors in the supernatants of B. toyonensis BV-17. (a) FPLC chromatogram of the secretion from B. toyonensis BV-17. The horizontal axis shows the eluted fractions (67 in total). The blue curve shows the absorbance at A280. (b) Cell viability by CCK-8 assay is conducted after exposure to different eluted fractions. Data are from the mean with SD in triplicates. (c) 12% SDS-PAGE gel analysis of eluted proteins with coomassie staining. M: marker. 23–25 (cytotoxic fractions). 21, 22, 26, 27, 30 (adjacent non-cytotoxic fractions). (d) Expression analysis of the recombinant HBL-B, HBL-L1, and HBL-L2 in the E. coli BL21 by Western blotting. (e) Mechanism of cytotoxicity toward the HCT116 cells among three components of HBL. The cells are treated with 10 µg/ml recombinant proteins for 5 min. (f) Sequential action manner analysis of the HBL three components.
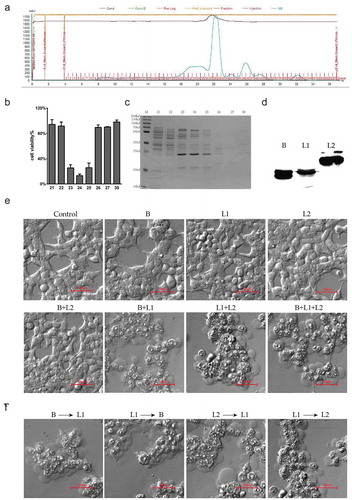
Table 3. Cytotoxic activity of HBL toxins against various mammal cells.
Figure 3. HBL rapidly kills various cancer cells with high concentrations and significantly inhibits cell proliferation with low concentrations. (a) The morphology changes of cells in treatment with 10 µg/ml HBL over time. Red arrows represent the dead cells with blebs formation. (b) Apoptosis analysis by flow cytometry after incubating with HBL for 5 min. (c) The alterations of various cell morphology after exposed to 2.5 µg/ml HBL toxins for 30 min. (d) Histogram of double-positive cells in HBL and control groups, which represent the dead cells. (e) Cell viability by CCK-8 assay is conducted after exposure to different concentrations of HBL toxins. (f) Cell proliferation is measured by CCK-8 assay within 48 hours. HCT116 cancer cells are treated with HBL at 0.1 µg/ml and PBS, respectively. (g) Clone formation assay of HCT116 cancer cells treated with different concentrations of HBL. (***p < .001, **p < .01, unpaired student’s t test, data are from the mean with SD in triplicates).
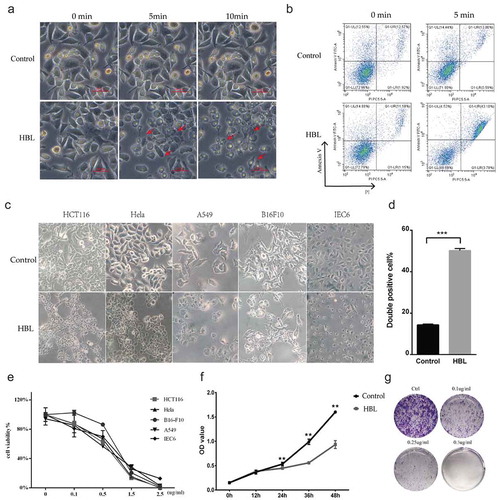
Figure 4. HBL significantly inhibits the growth of subcutaneous tumors in vivo. (a) The schedule of experiments in C57BL/6 mice. (b) The excised tumor tissues of C57BL/6 mice from the two groups at day 22. (c) Measurement of MC38 tumor volume in the two groups over different day points. (d) Gross morphology of the spleen from the two groups in sacrificed mice. (e) Histogram of the spleen volume in the two groups. (f) The schedule of experiments in nude mice. (g) The excised tumor tissues of nude mice from the two groups at day 31. (h) Measurement of HCT116 tumor volume in the two groups over time. (***p < .001, *p < .05, unpaired student’s t test, data are from the mean with SEM. Red arrows represent one treatment).
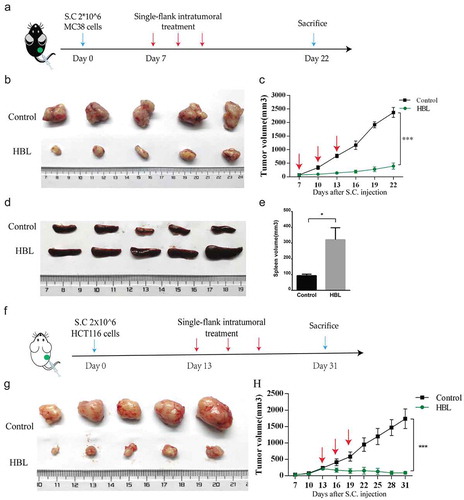
Figure 5. HBL also inhibits the growth of untreated tumors in vivo. (a) The schedule of experiments in vivo. 1 × 10⁵ MC38 cells were subcutaneously injected into the bilateral sub-axillary tissues. (b) The excised treated tumor tissues of C57BL/6 mice from the two groups at day 25. (c) Measurement of treated MC38 tumor volume in the two groups over time. (d) The excised untreated tumor tissues of C57BL/6 mice from the two groups at day 25. (e) Measurement of untreated MC38 tumor volume in the two groups over time. (***p < .001, unpaired student’s t test, data are from the mean with SEM. Red arrows represent the treatment.).
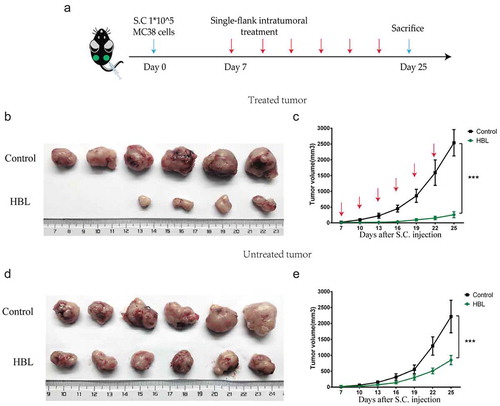
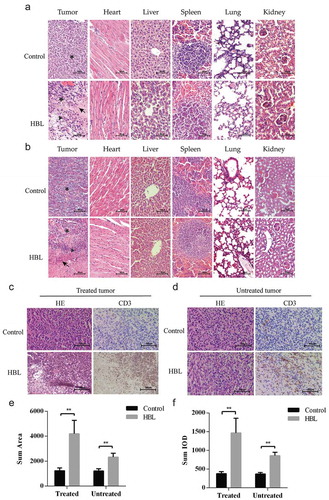
Figure 6. Histological evaluation of tumor tissues and distant organs. (a) The effect of HBL treatment on MC38 tumor tissues and distant organs in C57BL/6 mice. (b) The effect of HBL treatment on HCT116 tumor tissues and distant organs in nude mice. (c) The histological change and T cell infiltration in treated MC38 tumor tissues of the HBL group. (d) The histological change and T cell infiltration in untreated MC38 tumor tissues of the HBL group. (e) Histogram of sum area in T cell infiltration on both sides of MC38 tumor. (f) Histogram of sum IOD (integral optical density) in T cell infiltration on both sides of MC38 tumor. (★ represents tumor cell, ▲ represents inflammatory cells, and ↖ represents necrosis, **p < .01, unpaired student’s t test, data are from the mean with SEM. Red arrows represent the treatment.).