
Figures & data
Figure 1. The experimental design and Lp082 adaptive evolution within host gut. (a) The experimental design. Control (n = 5 animals), PRO (n = 6 animals), GPC (n = 6 animals), and GPP (n = 6 animals). (b–c) The temporal dynamics of the relative abundance and the mutation frequency (SNPs) of Lp082 among the three groups, error bar: mean±SD. (d) Every SNP location was marked on the reference genome of Lp082.
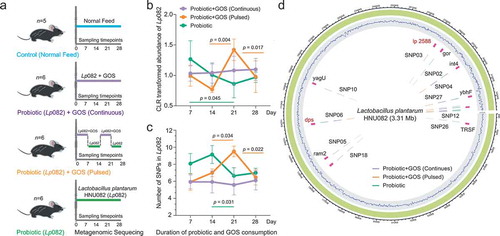
Figure 2. The indigenous intestinal microbiome response to the probiotic ingestion at the taxonomic level. (a) The PCoA plot based on the Bray–Curtis distance metric of species-level taxonomic profiles of fecal samples in each group. The points in different colors represented the samples in different groups, and the gradation of same color represented the samples in the same group but different time points. (b) The Bray–Curtis distance between samples in control and each of treatment groups at each time point, error bar: mean±SD. (c) The changes in taxonomic Shannon diversity compared to the control group at each time point, error bar: mean±SD. (d) The heatmaps showing significantly changed species-level taxa from control in each group. (e) The co-occurrence networks indicating the ecological relationships between Lp082 and indigenous intestinal species under each of treatments. The nodes in different colors represented by members in the community, i.e. Lp082, species positively correlated with probiotic, and species negatively correlated with probiotic. The edges are colored by sign and strength of correlation between a pair of nodes, which calculated based on the Spearman correlation coefficients.
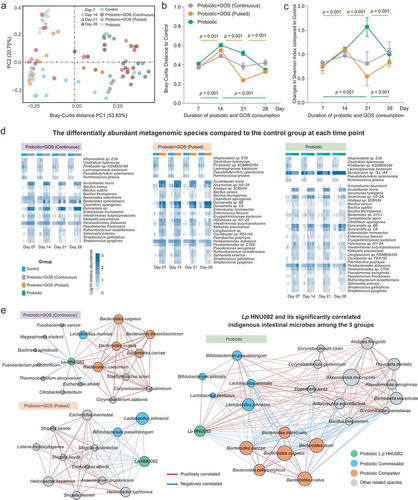
Figure 3. The consumption of the probiotic with prebiotic featured the temporal changes in the CAZymes of indigenous gut microbiome. (a) The PCoA plot based on Bray–Curtis distance of CAZymes profiles in the fecal microbiomes in each group. The points are colored by different treatment groups. (b) The Bray–Curtis distance between the control group and others based on CAZymes profiles at each time point, error bar: mean±SD. (c) The significantly changed CAZymes between the control and the other probiotic-treated (GPC, GPP, and PRO) groups, error bar: mean±SD.
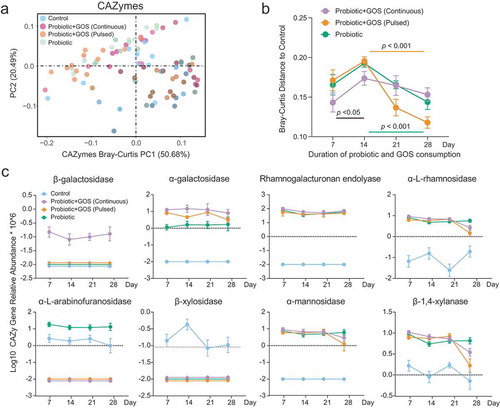
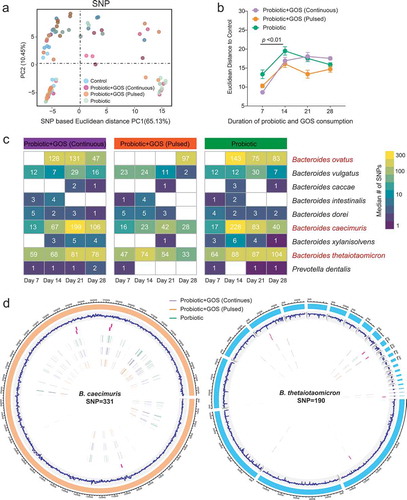
Figure 4. The GOS supplement did not reduce the adaptive mutations within indigenous gut microbiome due to probiotic consumption. (a) The PCoA plot based on the Euclidean distance of SNP profiles in each group. The points are colored by different treatments. (b) The Euclidean distance between the control group and others based on SNP profiles at each time point, error bar: mean±SD. (c) The heat map showing the median number of SNPs identified in each species in the probiotic-treated groups (GPC, GPP, and PRO) at each time point. (d) The distribution of identified SNPs in the genomes of the Bacteroides caecimuris and Bacteroides thetaiotaomicron.
Supplemental Material
Download MS Excel (1.2 MB)Supplemental Material
Download PDF (314.8 KB)Data and code availability
The sequence data reported in this paper have been deposited in the NCBI database (metagenomic sequencing data: PRJNA608079). More details about the figure construction and code can be found in Github: https://github.com/HNUmcc/HNU082_GOS_project