
Figures & data
Table 1. List of bacterial strains used in this study
Figure 1. Growth-promoting effects of existing prebiotics and Gal-β1,4-Rha on beneficial bacteria and the most prominent 27 bacterial species in human gut microbiota
Figure 2. The importance of the BL105A_0502 gene for the utilization of Gal-β1,4-Rha in B. longum 105-A
Figure 3. Growth inhibition of C. difficile by B. infantis in the presence of Gal-β1,4-Rha and the importance of BLIJ_2090 gene for the growth inhibition
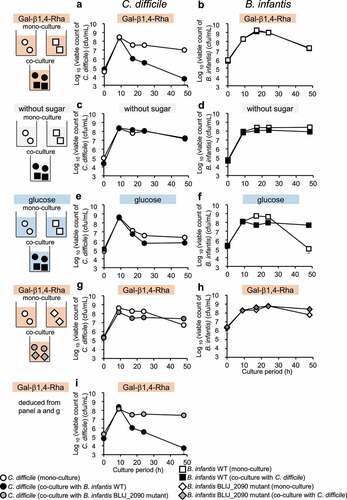
Figure 4. Inhibition of the production of CD toxins A and B by the combination of Gal-β1,4-Rha and B. infantis in fecal culture
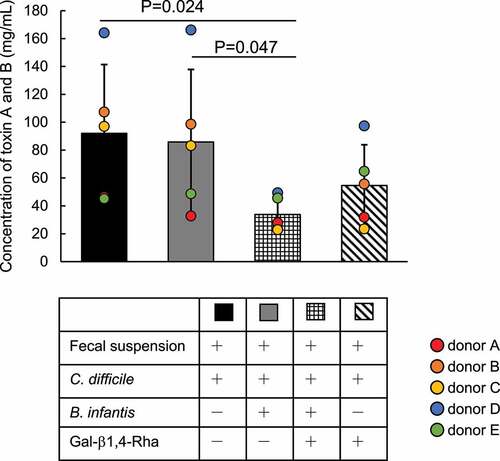
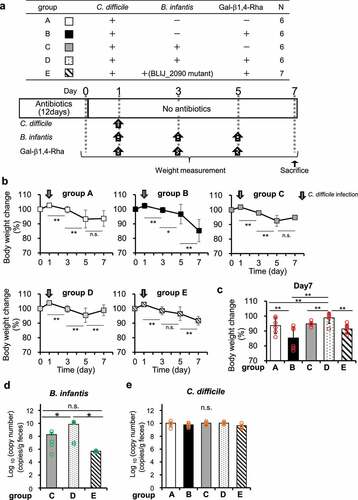
Figure 5. Effects of Gal-β1,4-Rha and B. infantis on weight loss in mice owing to C. difficile infection
Supplemental Material
Download Zip (552.4 KB)Data and materials availability
All data needed to evaluate the conclusions in this work are present in the paper and/or the Supplementary Materials.