Figures & data
Table 1. Mean proportion of correctly recognised targets in Experiment 1 by surface features overlap and study method.
Table 2. Mean proportion of correctly recognised targets in Experiment 2 by surface features overlap and study method.
Table 3. Mean proportion of correctly recognised targets in Experiment 3 by surface features overlap and study method.
Table 4. Mean proportion of correctly recognised targets in Experiment 4a by surface features overlap and study method.
Table 5. Mean proportion of correctly recognised targets in Experiment 4b by surface features overlap and study method.
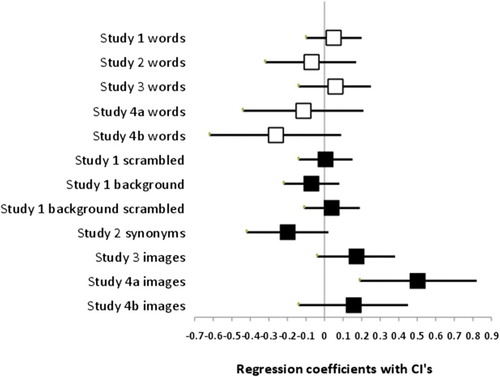
Figure 1. The regression coefficients, with their 95% confidence intervals, corresponding to the log of the odds ratio between restudy and testing with in the twelve different surface features overlap conditions of the five experiments. The white squares correspond to the five word-cue conditions, and the black squares correspond to the conditions where the surface features of the final test cues were altered as compared to the learning phase.